【气象可视化应用】空间降尺度实战应用(附MATLAB、Python和R语言多种代码实现)

本文介绍了如何使用MATLAB、Python和R语言进行空间降尺度的实战应用,包括Matlab的一维和二维插值、地理可视化,R语言的输出中文PDF及地图绘制,以及Python的地理可视化技术。

摘要生成于 C知道 ,由 DeepSeek-R1 满血版支持, 前往体验 >

1 Matlab

注:对插值没有特殊要求,直接CDO软件搞定

NCL内置函数&Python~github...

Matlab griddata、interp......


1.1 交叉相关

%两个时间序列不同超前滞后的交叉相关%时间序列采用unifrnd函数随机生成clc;clear;close allx = unifrnd (1, 100, 100, 1);y = unifrnd (1, 100, 100, 1);corrgram(x,y)
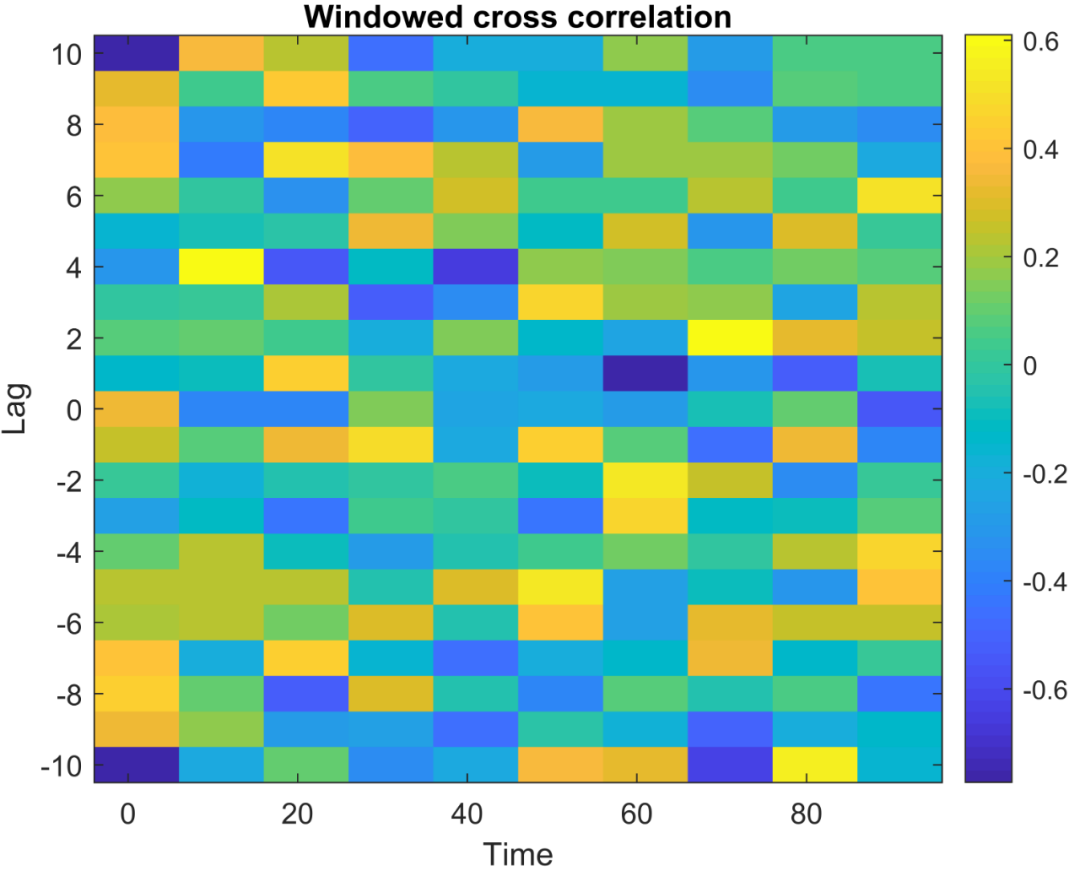

1.2 Matlab插值

1.2.1 一维插值函数interp2

% 一维插值函数interp2clc;clear;close all[x,y,z]=peaks(6);                                  %  MATLAB自带的测试函数
Use of NWAI-WG data   So far, NWAI-WG data have been used on a collaborative basis in publications (see the attached file). The major reasons are the data were not widely distributed. They were only used in our group and our collaborative networks. There were some cases with requests of the data made after people read Liu and Zou's (2012) paper. You have two options for using the data. Option 1: Collaboration with us. In this case, we will help you to describe the downscaling method and contribute to other parts of the paper such as comments/suggestions on the papers, if the fields are within our expertise. Option 2: Use of the data on your own. While option 1 for collaboration with us is welcome, option 2 is also highly encouraged, particularly, when the data are used for these research disciplines, rather than agricultural related. Thanks to Professor Yu who provides us with his group's web site (www.agrivy.com) as a media for distribution of the data.   Acknowledgment for option 1  “We acknowledge the modelling groups, the Program for Climate Model Diagnosis and Intercomparison (PCMDI) and the WCRP’s Working Group on Coupled Modelling (WGCM) for their roles in making available the WCRP CMIP5 multi-model dataset. Support of this dataset is provided by the Office of Science, US Department of Energy. Dr. Ian Macadam of the University of New South Wales downloaded the raw GCM monthly data. ”   Acknowledgment for option 2  “We acknowledge the modelling groups, the Program for Climate Model Diagnosis and Intercomparison (PCMDI) and the WCRP’s Working Group on Coupled Modelling (WGCM) for their roles in making available the WCRP CMIP5 multi-model dataset. Support of this dataset is provided by the Office of Science, US Department of Energy. Dr. Ian Macadam of the University of New South Wales downloaded the raw GCM monthly data. Dr. De Li Liu of the NSW Department of Primary Industries used NWAI-WG to downscale downscaled daily data. Also, thanks to AGRIVY (www.agrivy.com) provides us the data for this study.”
### 使用MATLAB实现影像降尺度处理 影像降尺度是指将低分辨率图像转换为高分辨率图像的过程。这一过程通常涉及空间插值其他增强技术来提高图像的空间细节。在MATLAB中,可以利用内置函数工具箱来进行此类操作。 #### 方法一:双线性插值法 双线性插值是一种简单有效的放大图像的方法。这种方法基于四个最近邻像素的加权平均计算新位置处的颜色值。 ```matlab % 原始低分辨率图像加载 lowResImage = imread('example_low_res_image.tif'); % 设置目标尺寸 targetSize = [desiredHeight desiredWidth]; % 应用双线性插值进行升采样 highResImage = imresize(lowResImage, targetSize,'bilinear'); imshow(highResImage); ``` 此代码片段展示了如何使用`imresize`命令指定新的大小并选择'`bilinear`'作为插值选项[^1]。 #### 方法二:超分辨重建(Super Resolution Reconstruction) 对于更复杂的场景,可能需要采用机器学习模型或深度神经网络来进行高质量的超分辨重建。MATLAB提供了预训练好的ESPCN(Efficient Sub-Pixel Convolutional Neural Network)用于快速实验: ```matlab % 加载测试图片 testImg = readimage(imageDatastore('path_to_images'), 1); % 创建一个espcn对象 net = espCN(); % 执行超分辨重建 srOutput = predict(net,testImg); figure; subplot(1,2,1); imshow(testImg); title('原始低分辨率图像') subplot(1,2,2); imshow(srOutput); title('经过ESP CN后的高分辨率图像') ``` 上述脚本说明了怎样调用MATLAB中的预定义CNN架构完成从LR到HR映射的任务。
评论
添加红包

请填写红包祝福语或标题

红包个数最小为10个

红包金额最低5元

当前余额3.43前往充值 >
需支付:10.00
成就一亿技术人!
领取后你会自动成为博主和红包主的粉丝 规则
hope_wisdom
发出的红包

打赏作者

文宇肃然

精神和物质鼓励你选一个吧

¥1 ¥2 ¥4 ¥6 ¥10 ¥20
扫码支付:¥1
获取中
扫码支付

您的余额不足,请更换扫码支付或充值

打赏作者

实付
使用余额支付
点击重新获取
扫码支付
钱包余额 0

抵扣说明:

1.余额是钱包充值的虚拟货币,按照1:1的比例进行支付金额的抵扣。
2.余额无法直接购买下载,可以购买VIP、付费专栏及课程。

余额充值