


用 TATR 做表检测与转换,让数据处理变得轻松又高效!
文章目录
Introduction
在文档分析领域,从非结构化信息中提取有组织数据的长期难题已经找到了答案,那就是 Table Transformer 的出现。这一微软研究院开发的 DETR(DEtection TRansformer)模型的创新改编,被纳入了 Hugging Face Transformers 框架中,标志着一个重要的进步。这个创新模型通过结合卷积神经网络与编码器-解码器 Transformers,实现了在检测表格和识别文档结构方面的卓越表现。
Overview
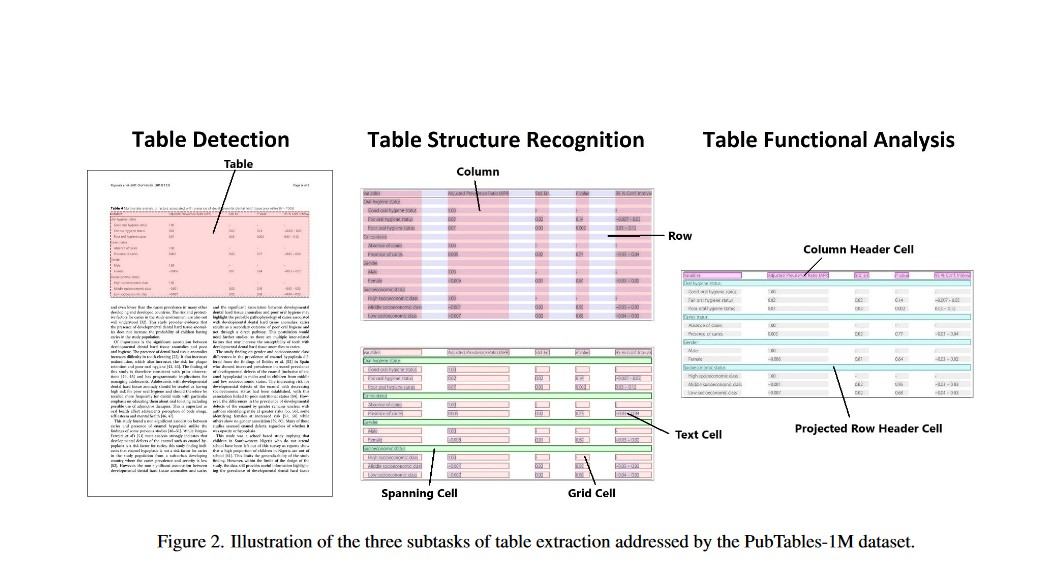
在Brandon Smock、Rohith Pesala 和 Robin Abraham 的研究论文《PubTables-1M: Towards comprehensive table extraction from unstructured documents 》中,首次引入了 Table Transformer 模型,并提出了一种新的数据集 PubTables-1M。该数据集旨在为从非结构化文档中提取表格提供一个基准,重点是表格结构识别和功能分析。作者在 Table Transformer 框架内训练了两个 DETR 模型:一个用于表格检测,另一个用于表格结构识别。
What Is DETR ?
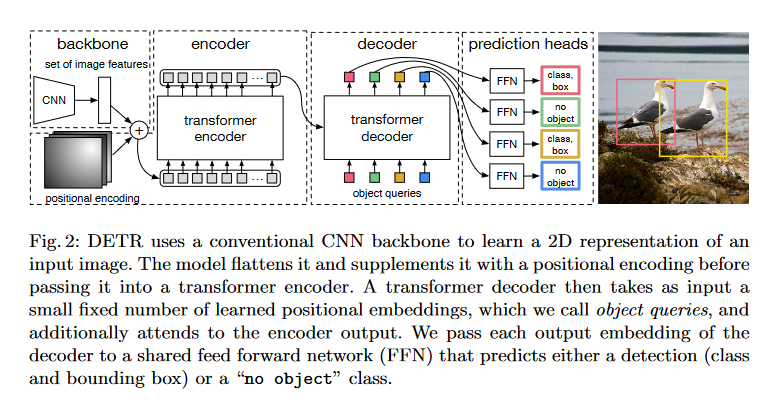
DETR 模型首次在 Nicolas Carion、Francisco Massa、Gabriel Synnaeve、Nicolas Usunier、Alexander Kirillov 和 Sergey Zagoruyko 的论文《End-to-End Object Detection with Transformers 》中提出。DETR 包括一个卷积骨干网络,后接一个编码器-解码器 Transformer,提供了一种端到端的训练方法,用于物体检测。它简化了诸如 Faster-R-CNN 和 Mask-R-CNN 等模型所依赖的区域建议、非极大值抑制和锚点生成等复杂技术。此外,通过在解码器输出中添加掩码头,DETR 展示了扩展到全景分割的潜力。
Abstract of DETR
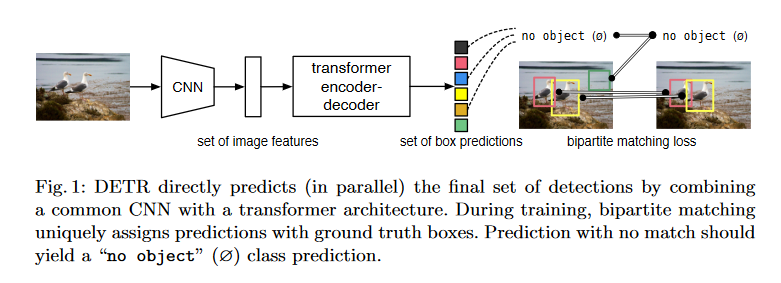
这种新方法将物体检测作为直接的集合预测问题,标志着与传统方法的不同。通过简化检测流程,这种模型消除了手工设计的各种组件,如非极大值抑制和锚点生成,这些组件通常编码了特定任务的先验知识。在这个新框架的核心,即 DEtection TRansformer (DETR),存在一个基于集合的全局损失,通过二分匹配和包含 Transformer 编码器-解码器层的架构,确保唯一性预测。使用一组预定义的学习对象查询,DETR 理解对象关系和整体图像上下文,以直接生成最终的一组并发预测。这个模型概念上简单明了,不依赖于专门的库,与许多当代探测器不同。在具有挑战性的 COCO 物体检测数据集上,DETR 展示了与著名且高度优化的 Faster R-CNN 基准相当的准确性和运行性能。此外,DETR 提供了简单化的泛化能力来生成全景分割,大幅超越了竞争基准。
Abstract of TATR
论文的摘要强调了最近机器学习在推断和提取非结构化文档中的表格结构方面的进展。它承认创建具有准确真实数据的大规模数据集的挑战,并介绍了 PubTables-1M 作为解决方案。该数据集包含近百万个来自科学文章的表格,支持各种输入格式,并提供详细的表头和位置信息,以进行表格结构识别。为了提高准确性,它采用了一种新的规范化程序,解决了以前数据集中观察到的真实数据不一致性。研究表明,该数据集在训练和评估模型表格结构识别性能方面的改进。此外,基于 Transformer 的物体检测模型在 PubTables-1M 上训练后,在检测、结构识别和功能分析方面表现出色,无需为这些任务进行专门的定制。
Understanding the Table Transformer
中心设计方面,DETR 模型最初是为目标检测和全景分割而设计的。它依赖于一个基础的卷积骨干网络,比如 ResNet-50 或 ResNet-101,然后连接一个编码器—解码器 Transformer 架构。使其独树一帜的是它的简化方法。相比于像 Faster R-CNN 或 Mask R-CNN 这样依赖于复杂机制(如区域提议和锚生成)的前辈,DETR 以端到端的方式运行。这种简洁性得益于一种高级的损失函数,称为双边匹配损失,允许简化的训练和改进,类似于在 BERT 模型中使用的方法。
优势对比 OCR
长期以来,光学字符识别(OCR)一直是文档分析的传统手段。然而,Table Transformer 提供了显著的优势:
-
结构识别: 虽然 OCR 在文本提取方面很在行,但 Table Transformer 不仅能提取文本,还能识别和重建表格结构。因此,它保留了数据的关系上下文,展现出更强的能力。
-
端到端训练: 与往往需要多个预处理步骤和特定领域调整的传统 OCR 方法相比,Table Transformer 的端到端训练简化了工作流程。此方法减少了复杂预处理的必要性,提高了效率。
-
减少对模板的依赖: OCR 强烈依赖预定的模板,因此在处理文档布局变化时显得僵硬。Table Transformer 对不同文档结构的适应性显著增强了其鲁棒性,减少了对刚性模板的依赖。
教程:用于 OCR 应用的 Table Transformer (TATR) 表检测与提取
设置环境
我们先来安装 Hugging Face Transformers 和 EasyOCR(一个开源 OCR 引擎)。
!pip install -q easyocr
接下来,我们加载一个预训练的用于表格检测的 Table Transformer。这里我们使用‘no_timm’版本来加载带有 Transformers 原生骨干的检查点。
from transformers import AutoModelForObjectDetection
model = AutoModelForObjectDetection.from_pretrained("microsoft/table-transformer-detection", revision="no_timm")
model.config.id2label
如果有 GPU 可用,我们会将模型移动到 GPU 上(预测会更快)。
import torch
device = "cuda" if torch.cuda.is_available() else "cpu"
model.to(device)
print("")
接下来,我们可以加载一个 PDF 图片。
from PIL import Image
from huggingface_hub import hf_hub_download
# 加载一个示例图片
file_path = hf_hub_download(repo_id="nielsr/example-pdf", repo_type="dataset", filename="image.png")
image = Image.open(file_path).convert("RGB")
# 让我们显示一个较小的尺寸
width, height = image.size
display(image.resize((int(0.6*width), int(0.6*height))))
我们可以按如下方式准备图像以供模型使用:
from torchvision import transforms
class MaxResize(object):
    def __init__(self, max_size=800):
        self.max_size = max_size
    def __call__(self, image):
        width, height = image.size
        current_max_size = max(width, height)
        scale = self.max_size / current_max_size
        resized_image = image.resize((int(round(scale*width)), int(round(scale*height))))
        return resized_image
detection_transform = transforms.Compose([
    MaxResize(800),
    transforms.ToTensor(),
    transforms.Normalize([0.485, 0.456, 0.406], [0.229, 0.224, 0.225])
])
pixel_values = detection_transform(image).unsqueeze(0)
pixel_values = pixel_values.to(device)
print(pixel_values.shape)
接下来,我们将像素值传递给模型。模型输出的 logits 形状为 (batch_size, num_queries, num_labels + 1)。这个 +1 表示“无对象”类。
import torch
with torch.no_grad():
  outputs = model(pixel_values)
接下来,我们选取一个实际类别(即不是“无对象”)的预测结果。
用于输出边界框的后处理
def box_cxcywh_to_xyxy(x):
    x_c, y_c, w, h = x.unbind(-1)
    b = [(x_c - 0.5 * w), (y_c - 0.5 * h), (x_c + 0.5 * w), (y_c + 0.5 * h)]
    return torch.stack(b, dim=1)

def rescale_bboxes(out_bbox, size):
    img_w, img_h = size
    b = box_cxcywh_to_xyxy(out_bbox)
    b = b * torch.tensor([img_w, img_h, img_w, img_h], dtype=torch.float32)
    return b

# 更新 id2label 以包含“无对象”
id2label = model.config.id2label
id2label[len(model.config.id2label)] = "no object"

def outputs_to_objects(outputs, img_size, id2label):
    m = outputs.logits.softmax(-1).max(-1)
    pred_labels = list(m.indices.detach().cpu().numpy())[0]
    pred_scores = list(m.values.detach().cpu().numpy())[0]
    pred_bboxes = outputs['pred_boxes'].detach().cpu()[0]
    pred_bboxes = [elem.tolist() for elem in rescale_bboxes(pred_bboxes, img_size)]

    objects = []
    for label, score, bbox in zip(pred_labels, pred_scores, pred_bboxes):
        class_label = id2label[int(label)]
        if not class_label == 'no object':
            objects.append({'label': class_label, 'score': float(score), 'bbox': [float(elem) for elem in bbox]})

    return objects

objects = outputs_to_objects(outputs, image.size, id2label)

print(objects)
我们可以在图像上可视化检测结果。
import matplotlib.pyplot as plt
import matplotlib.patches as patches
from matplotlib.patches import Patch

def fig2img(fig):
    """Convert a Matplotlib figure to a PIL Image and return it"""
    import io
    buf = io.BytesIO()
    fig.savefig(buf)
    buf.seek(0)
    img = Image.open(buf)
    return img

def visualize_detected_tables(img, det_tables, out_path=None):
    plt.imshow(img, interpolation="lanczos")
    fig = plt.gcf()
    fig.set_size_inches(20, 20)
    ax = plt.gca()

    for det_table in det_tables:
        bbox = det_table['bbox']
        if det_table['label'] == 'table':
            facecolor = (1, 0, 0.45)
            edgecolor = (1, 0, 0.45)
            alpha = 0.3
            linewidth = 2
            hatch = '//'
        elif det_table['label'] == 'table rotated':
            facecolor = (0.95, 0.6, 0.1)
            edgecolor = (0.95, 0.6, 0.1)
            alpha = 0.3
            linewidth = 2
            hatch = '//'
        else:
            continue

        rect = patches.Rectangle(bbox[:2], bbox[2] - bbox[0], bbox[3] - bbox[1], linewidth=linewidth, edgecolor='none', facecolor=facecolor, alpha=0.1)
        ax.add_patch(rect)
        rect = patches.Rectangle(bbox[:2], bbox[2] - bbox[0], bbox[3] - bbox[1], linewidth=linewidth, edgecolor=edgecolor, facecolor='none', linestyle='-', alpha=alpha)
        ax.add_patch(rect)
        rect = patches.Rectangle(bbox[:2], bbox[2] - bbox[0], bbox[3] - bbox[1], linewidth=0, edgecolor=edgecolor, facecolor='none', linestyle='-', hatch=hatch, alpha=0.2)
        ax.add_patch(rect)

    plt.xticks([], [])
    plt.yticks([], [])

    legend_elements = [
        Patch(facecolor=(1, 0, 0.45), edgecolor=(1, 0, 0.45), label='Table', hatch='//', alpha=0.3),
        Patch(facecolor=(0.95, 0.6, 0.1), edgecolor=(0.95, 0.6, 0.1), label='Table (rotated)', hatch='//', alpha=0.3)
    ]
    plt.legend(handles=legend_elements, bbox_to_anchor=(0.5, -0.02), loc='upper center', borderaxespad=0, fontsize=10, ncol=2)
    plt.gcf().set_size_inches(10, 10)
    plt.axis('off')

    if out_path is not None:
        plt.savefig(out_path, bbox_inches='tight', dpi=150)

    return fig

fig = visualize_detected_tables(image, objects)
visualized_image = fig2img(fig)
接下来我们从图像中裁剪出表格。
def objects_to_crops(img, tokens, objects, class_thresholds, padding=10):
    table_crops = []

    for obj in objects:
        if obj['score'] < class_thresholds[obj['label']]:
            continue

        cropped_table = {}
        bbox = obj['bbox']
        bbox = [bbox[0] - padding, bbox[1] - padding, bbox[2] + padding, bbox[3] + padding]
        cropped_img = img.crop(bbox)
        table_tokens = [token for token in tokens if iob(token['bbox'], bbox) >= 0.5]

        for token in table_tokens:
            token['bbox'] = [
                token['bbox'][0] - bbox[0],
                token['bbox'][1] - bbox[1],
                token['bbox'][2] - bbox[0],
                token['bbox'][3] - bbox[1]
            ]

        if obj['label'] == 'table rotated':
            cropped_img = cropped_img.rotate(270, expand=True)
            for token in table_tokens:


                bbox = token['bbox']
                bbox = [cropped_img.size[0]-bbox[3]-1,

                        bbox[0],

                        cropped_img.size[0]-bbox[1]-1,

                        bbox[2]]

                token['bbox'] = bbox

        cropped_table['image'] = cropped_img

        cropped_table['tokens'] = table_tokens

        table_crops.append(cropped_table)

    return table_crops


tokens = []

detection_class_thresholds = {

    "table": 0.5,

    "table rotated": 0.5,

    "no object": 10

}

crop_padding = 10

tables_crops = objects_to_crops(image, tokens, objects, detection_class_thresholds, padding=0)

cropped_table = tables_crops[0]['image'].convert("RGB")

cropped_table

cropped_table.save("table.jpg")
接下来,我们加载一个用于表结构识别的预训练 Table Transformer。
from transformers import TableTransformerForObjectDetection

# new v1.1 checkpoints require no timm anymore

structure_model = TableTransformerForObjectDetection.from_pretrained("microsoft/table-structure-recognition-v1.1-all")

structure_model.to(device)

print("")
我们为模型准备裁剪后的表格图像,并进行前向传递。
structure_transform = transforms.Compose([

    MaxResize(1000),

    transforms.ToTensor(),

    transforms.Normalize([0.485, 0.456, 0.406], [0.229, 0.224, 0.225])

])

pixel_values = structure_transform(cropped_table).unsqueeze(0)

pixel_values = pixel_values.to(device)

print(pixel_values.shape)

# forward pass

with torch.no_grad():

  outputs = structure_model(pixel_values)
接下来,我们获取预测结果。
# update id2label to include "no object"

structure_id2label = structure_model.config.id2label

structure_id2label[len(structure_id2label)] = "no object"

cells = outputs_to_objects(outputs, cropped_table.size, structure_id2label)

print(cells)
我们可以使用 PIL 的 ImageDraw 模块可视化所有识别到的单元格。
from PIL import ImageDraw

cropped_table_visualized = cropped_table.copy()

draw = ImageDraw.Draw(cropped_table_visualized)

for cell in cells:

    draw.rectangle(cell["bbox"], outline="red")

cropped_table_visualized
另一种绘图方法是选择一个类进行可视化,如‘table row’:
def plot_results(cells, class_to_visualize):

    if class_to_visualize not in structure_model.config.id2label.values():

      raise ValueError("Class should be one of the available classes")

    plt.figure(figsize=(16,10))

    plt.imshow(cropped_table)

    ax = plt.gca()

    for cell in cells:

        score = cell["score"]

        bbox = cell["bbox"]

        label = cell["label"]

        if label == class_to_visualize:

          xmin, ymin, xmax, ymax = tuple(bbox)

          ax.add_patch(plt.Rectangle((xmin, ymin), xmax - xmin, ymax - ymin, fill=False, color="red", linewidth=3))

          text = f'{cell["label"]}: {score:0.2f}'

          ax.text(xmin, ymin, text, fontsize=15, bbox=dict(facecolor='yellow', alpha=0.5))

          plt.axis('off')

plot_results(cells, class_to_visualize="table row")
按行应用 OCR
首先,我们通过查看行和列的交点来逐行获取各个单元格的坐标。接下来,我们逐行对每个单元格应用 OCR。
或者,也可以逐列进行 OCR 等等。
def get_cell_coordinates_by_row(table_data):

    # Extract rows and columns

    rows = [entry for entry in table_data if entry['label'] == 'table row']

    columns = [entry for entry in table_data if entry['label'] == 'table column']

    # Sort rows and columns by their Y and X coordinates, respectively

    rows.sort(key=lambda x: x['bbox'][1])

    columns.sort(key=lambda x: x['bbox'][0])

    # Function to find cell coordinates

    def find_cell_coordinates(row, column):

        cell_bbox = [column['bbox'][0], row['bbox'][1], column['bbox'][2], row['bbox'][3]]

        return cell_bbox

    # Generate cell coordinates and count cells in each row

    cell_coordinates = []

    for row in rows:

        row_cells = []

        for column in columns:

            cell_bbox = find_cell_coordinates(row, column)

            row_cells.append({'column': column['bbox'], 'cell': cell_bbox})

        # Sort cells in the row by X coordinate

        row_cells.sort(key=lambda x: x['column'][0])

        # Append row information to cell_coordinates

        cell_coordinates.append({'row': row['bbox'], 'cells': row_cells, 'cell_count': len(row_cells)})

    # Sort rows from top to bottom

    cell_coordinates.sort(key=lambda x: x['row'][1])

    return cell_coordinates

cell_coordinates = get_cell_coordinates_by_row(cells)

len(cell_coordinates)

len(cell_coordinates[0]["cells"])

for row in cell_coordinates:

  print(row["cells"])

import numpy as np

import csv

import easyocr

from tqdm.auto import tqdm
reader = easyocr.Reader(['en']) # 这只需要运行一次以将模型加载到内存中
def apply_ocr(cell_coordinates):
    # 逐行进行 OCR
    data = dict()
    max_num_columns = 0
    for idx, row in enumerate(tqdm(cell_coordinates)):
        row_text = []
        for cell in row["cells"]:
            # 从图像中裁剪出单元格
            cell_image = np.array(cropped_table.crop(cell["cell"]))
            # 应用 OCR
            result = reader.readtext(np.array(cell_image))
            if len(result) > 0:
                # 打印 OCR 结果
                text = " ".join([x[1] for x in result])
                row_text.append(text)
        if len(row_text) > max_num_columns:
            max_num_columns = len(row_text)
        data[idx] = row_text
    print("Max number of columns:", max_num_columns)
    # 填补没有最大列数的行
    # 确保所有行都有相同的列数
    for row, row_data in data.copy().items():
        if len(row_data) != max_num_columns:
            row_data = row_data + ["" for _ in range(max_num_columns - len(row_data))]
        data[row] = row_data
    return data
data = apply_ocr(cell_coordinates)
for row, row_data in data.items():
    print(row_data)
我们最终得到一个包含数据的 CSV 文件。
结论
总而言之,Table Transformer 在文档分析领域,特别是处理包含复杂表格的 PDF 文件时,代表了一个重要的进步。它创新地融合了多模态功能,从而重新定义了从这些复杂文档中提取信息的方式。
这款基于 DETR 框架的开创性模型,不仅可以解读 PDF 中的文本,还能全面识别、重构和保留表格的详细结构。通过无缝结合卷积骨干网和编码器-解码器 Transformer 架构,它在检测表格和识别其结构方面表现出色。
与传统光学字符识别(OCR)相比,它具有多方面的优势:从识别和重建表格布局的能力,到简化工作流并减少对不灵活模板依赖的端到端训练。Table Transformer 对不同文档结构的适应能力彰显了其强大和灵活性。
随着文档分析的进步,Table Transformer 的崛起作为一个强有力的工具,代表了一个关键时刻,承诺提供高效、精准并且更简化的信息提取方法,从大量包含有价值表格数据的 PDF 文件中提取结构化信息。它的影响不仅改变了文档处理方式,还为依赖多模态文档全面信息提取的各个领域带来了更广阔的应用前景。
参考文献
TATR Repo: https://github.com/microsoft/table-transformer
Research Paper: PubTables-1M: Towards comprehensive table extraction from unstructured documents
Research Paper: End-to-End Object Detection with Transformers


 1654
1654

 被折叠的 条评论
为什么被折叠?
被折叠的 条评论
为什么被折叠?
 到【灌水乐园】发言


