


ArcGIS统计矢量内栅格均值(最小值、最大值)邻域统计
假如我们要统计矢量内各栅格的均值:
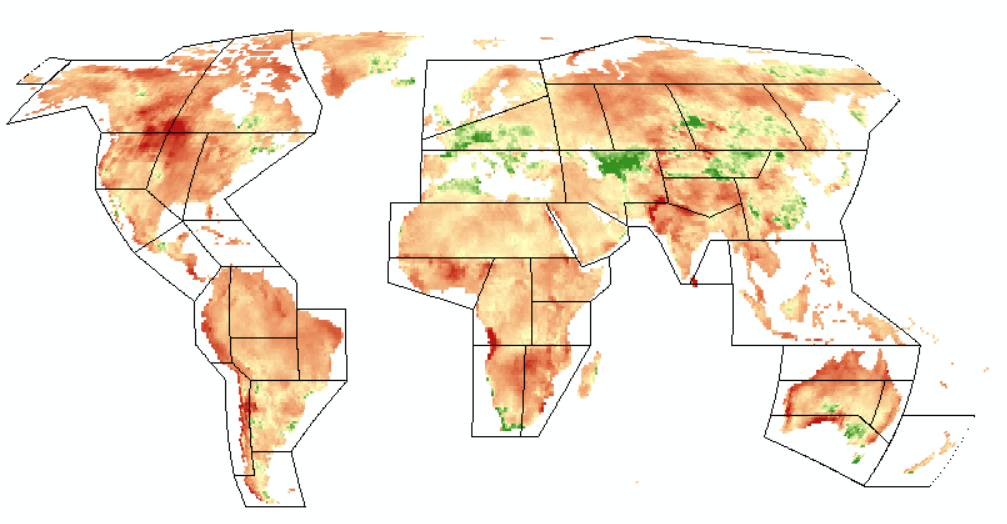
图中的矢量是IPCC提供的全球分区。
栅格是我自己计算得到的热浪频率。
使用以下工具:
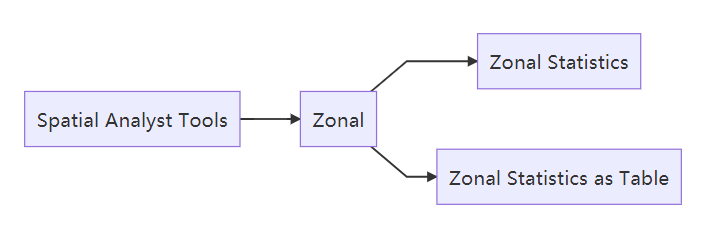
这两个工具区别:
- Zonal Statistics生成矢量的栅格化图,含有统计量的属性
- as Table生成一张Table,便于后期转Excel或进行空间链接
这里选择as Table
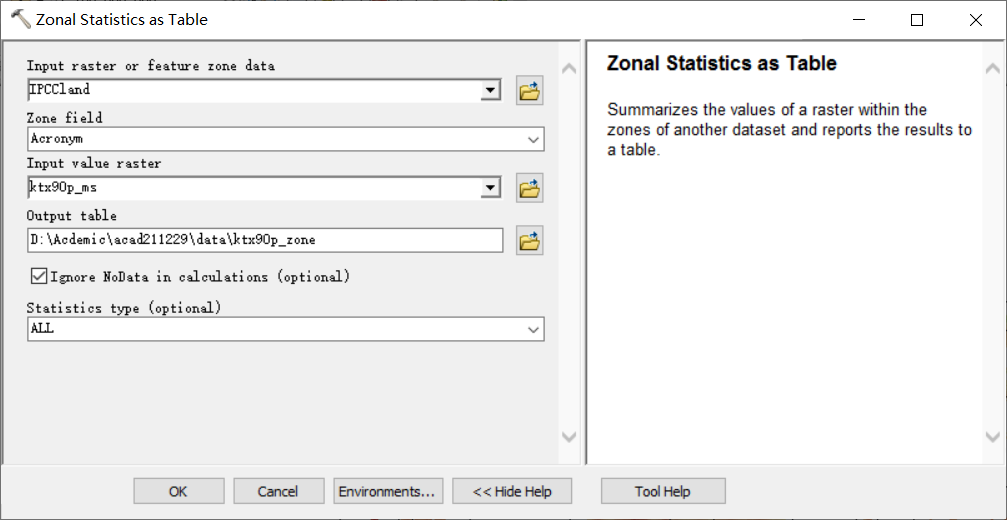
各参数:
- raster or feature是进行邻域统计的底图,可以是栅格或矢量,这里是矢量
- Zone field指你统计底图的主键
- value raster是待统计的栅格
- 当有空值时,勾选这个可以忽略空值的计算,要勾选
统计的类型有以下几种,一般选择ALL,先看看情况。
Statistic type to be calculated.
- ALL—All of the statistics will be calculated. This is the default.
- MEAN—Calculates the average of all cells in the value raster that belong to the same zone as the output cell.
- MAJORITY—Determines the value that occurs most often of all cells in the value raster that belong to the same zone as the output cell.
- MAXIMUM—Determines the largest value of all cells in the value raster that belong to the same zone as the output cell.
- MEDIAN—Determines the median value of all cells in the value raster that belong to the same zone as the output cell.
- MINIMUM—Determines the smallest value of all cells in the value raster that belong to the same zone as the output cell.
- MINORITY—Determines the value that occurs least often of all cells in the value raster that belong to the same zone as the output cell.
- RANGE—Calculates the difference between the largest and smallest value of all cells in the value raster that belong to the same zone as the output cell.
- STD—Calculates the standard deviation of all cells in the value raster that belong to the same zone as the output cell.
- SUM—Calculates the total value of all cells in the value raster that belong to the same zone as the output cell.
- VARIETY—Calculates the number of unique values for all cells in the value raster that belong to the same zone as the output cell.
- MIN_MAX—Both the minimum and maximum statistics are calculated.
- MEAN_STD—Both the mean and standard deviation statistics are calculated.
- MIN_MAX_MEAN—The minimum, maximum and mean statistics are calculated.
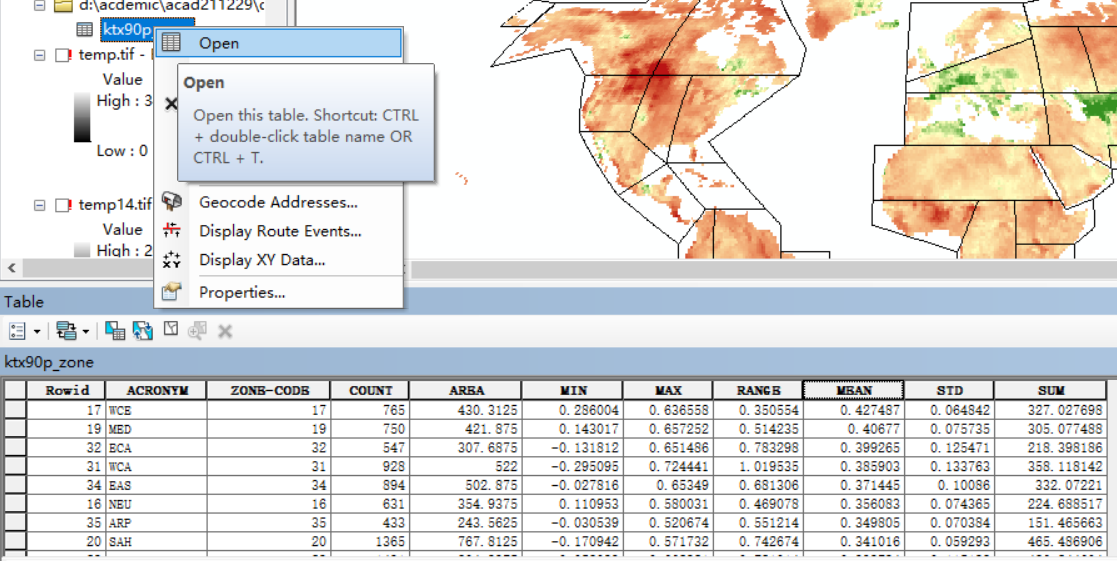
统计结果右键——Open就可以打开看了
然后再导出Excel

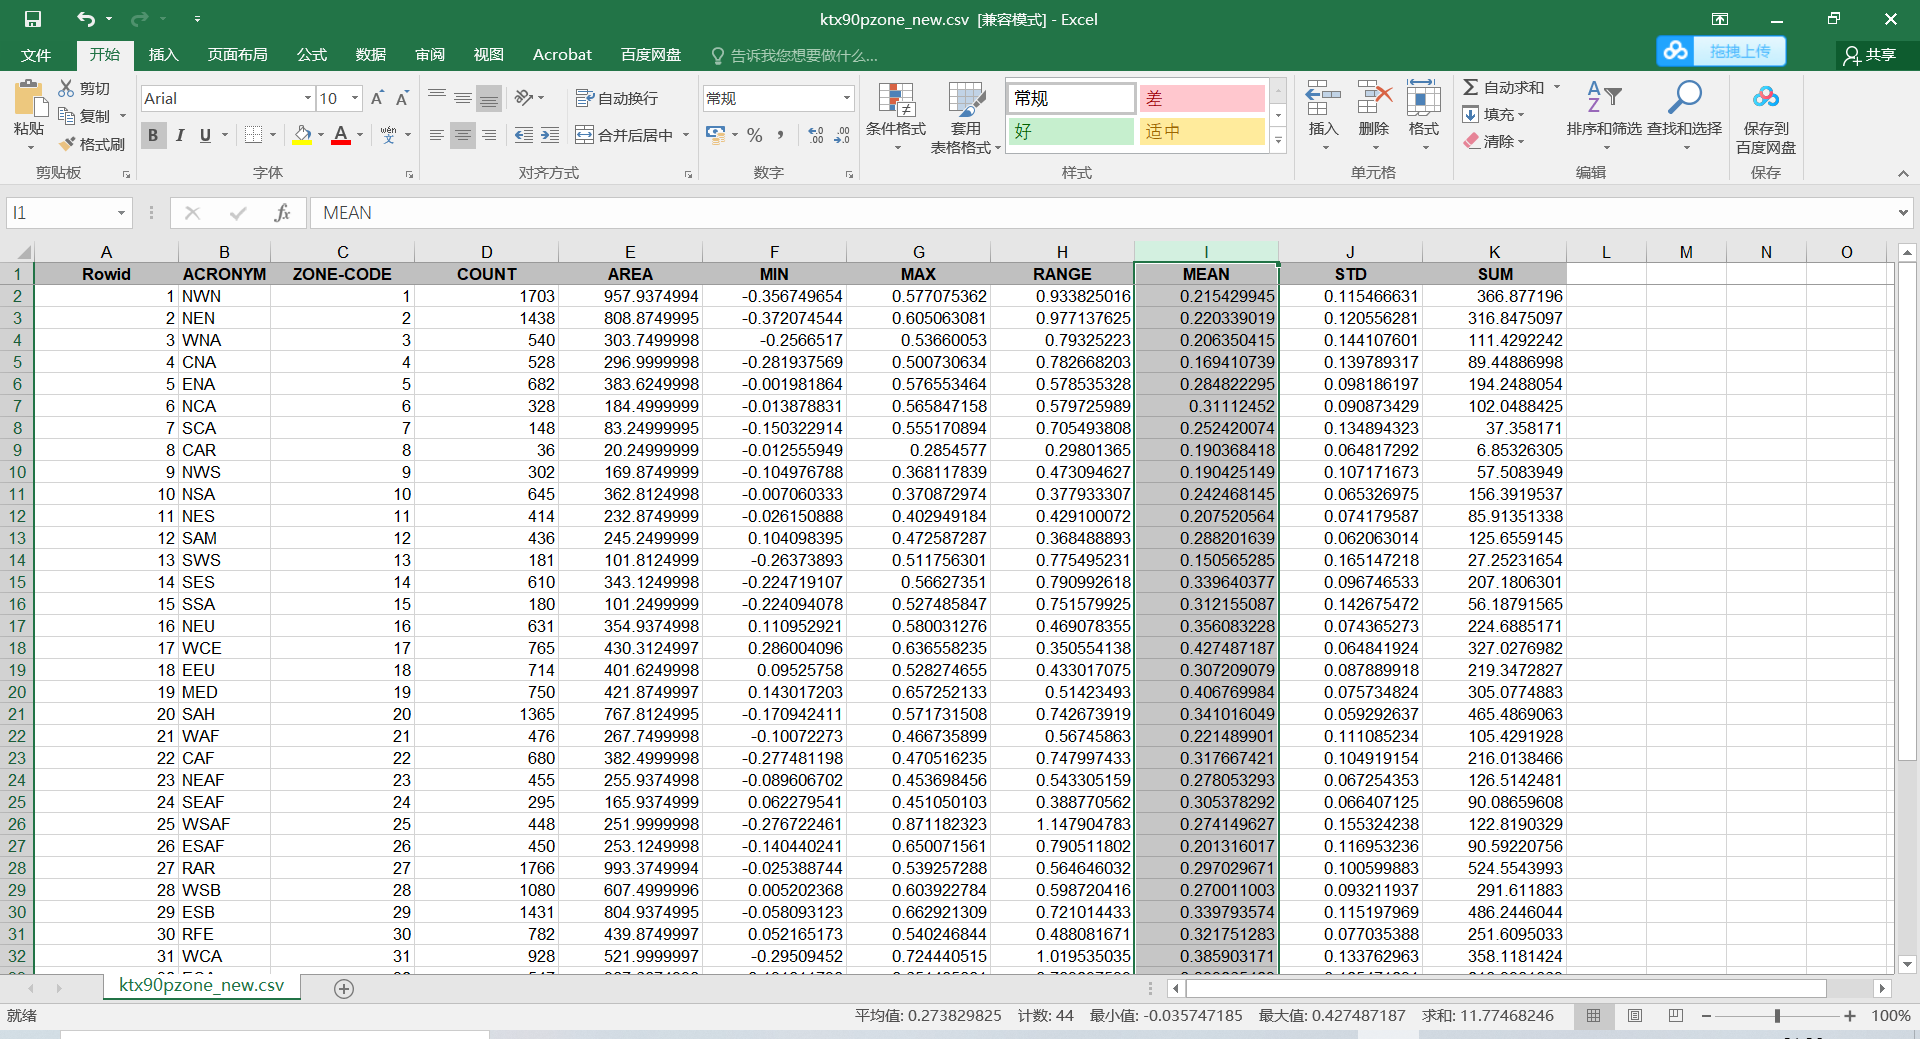
大功告成!


 2308
2308


 被折叠的 条评论
为什么被折叠?
被折叠的 条评论
为什么被折叠?
 到【灌水乐园】发言


