


 本文介绍如何使用高德地图API实现路线规划功能,包括驾车路线规划、获取经纬度、改变路线颜色及添加途经点。
在地图应用中,常见的应用之一应该就有查询两个地方的线路规划吧,高德地图提供了驾车路线规划、货车路线规划、公车换乘服务、步行导航服务、骑行路径规划服务等,这里我用的是驾车路线规划做一个列子。
驾车路线规划使用的插件是AMap.Driving,需要在AMap.plugin中进行初始化,方法不在赘述,可以看这个官方列子:https://lbs.amap.com/api/javascript-api/guide/services/navigation。
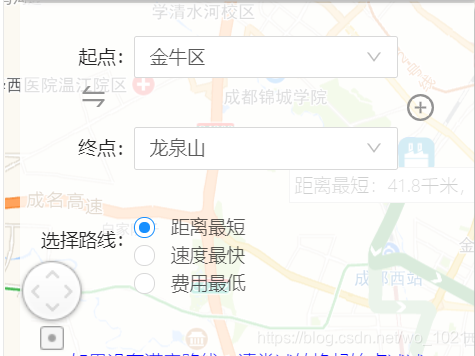
初始化完成后,首先需要两个定位点,作为起点和终点,主要就是知道两个定位点的经纬度,我的起点和终点是使用下拉选择来实现的,如果需要自己搜索定位点的话,可以使用高德地图的输入提示和POI搜索插件来进行搜索并得到经纬度,具体方法可以参照文章JSAPI 高德地图应用--关键字搜索、POI搜索定位,获取经纬度
     least_time = new AMap.Driving({
        policy: AMap.DrivingPolicy.LEAST_TIME,//速度最快的策略
        map: map,
        autoFitView: true,//自动调整地图视野使绘制的路线处于视口的可见范围

      })
        /*
        * startLngLat:起始点经纬度
        * endLngLat:终点经纬度
        * waypoints:途经点的经纬度,是一个经纬度的数组集合,后面说怎么添加
        */
      least_time.search(startLngLat, endLngLat, { waypoints }, (status, result) => {
        if (status === 'complete') {
          //这里status === 'complete'的时候证明线路已经成功渲染了,但是因为我的业务需求,需要把线路的颜色改变一下,所以我把得到的线路路径的经纬度拿到做了处理
          const { routes = [] } = result //所有线路点的集合
          const { steps = [] } = routes[0]

          const pathArr = []
          steps.map(i => {
            pathArr.push(i.path)
            return pathArr
          })
          const path = flatten(pathArr) //通过合并数组的方法,得到所有点的集合


          // 绘制轨迹,利用折线类方法进行渲染
          const polyline = new window.AMap.Polyline({
            map: map,
            path,
            showDir: true,
            strokeColor: type === 'fast' ? '#459c50' : '#9ac799',  // 线颜色,这里颜色做了判断,让当前选中的线路颜色比没有选中的颜色深一些,类似于高德的地图路线推荐
            strokeOpacity: 1,     // 线透明度
            strokeWeight: 10,      // 线宽
            strokeStyle: 'solid',  // 线样式
            lineJoin: 'round',  // 折线拐点的绘制样式
            zIndex: type === 'fast' ? 999 : 200,//
          })
          const distance = (result.routes[0].distance / 1000).toFixed(1) //这个可以知道总里程,单位为米,所以我处理了一下
          const time = toHourMinute(parseInt(result.routes[0].time / 60)) //这个可以知道总时间,同样我处理成了小时和分钟

        } else {
          console.log(result)
        }
      })


function flatten (arr) { // 合并多个数组
  const result = []
  for (let i = 0; i < arr.length; i++) {
    for (let j = 0; j < arr[i].length; j++) {
      result.push(arr[i][j])

    }
  }
  return result
}

// 将分钟转为小时
function toHourMinute (minutes) {
  return (Math.floor(minutes / 60) + '小时' + (minutes % 60) + '分')
}
渲染的方法就是这样,上面的type就是速度最快、距离最短、费用最低的value值,然后可以分别不同的value,调用不同的驾车策略来渲染不同的路线
AMap.DrivingPolicy.LEAST_TIME //最快捷模式
AMap.DrivingPolicy.LEAST_FEE //最经济模式
AMap.DrivingPolicy.LEAST_DISTANCE //最短距离模式
AMap.DrivingPolicy.REAL_TRAFFIC //考虑实时路况
//在初始化路线时展示直接设置policy
distance = new AMap.Driving({
policy: AMap.DrivingPolicy.LEAST_DISTANCE,
map: map,
autoFitView: true
})
//改变驾车策略
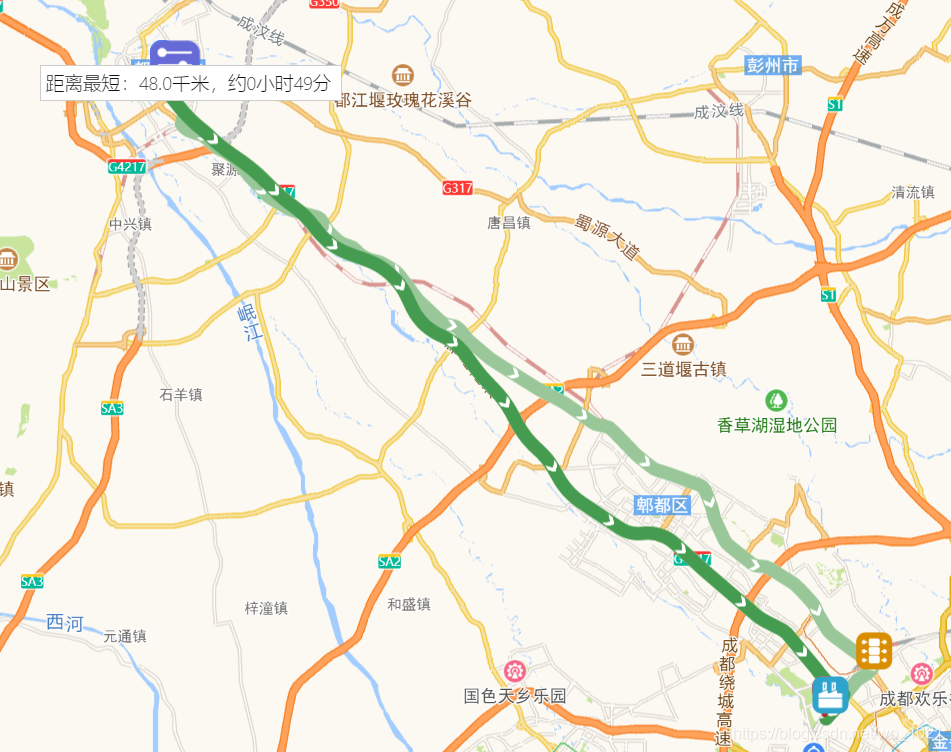
distance.setPolicy(AMap.DrivingPolicy.LEAST_TIME) 如果三条线路要同时展示的话,需要使用不同的驾车策略,各调用一次即可。效果如下:
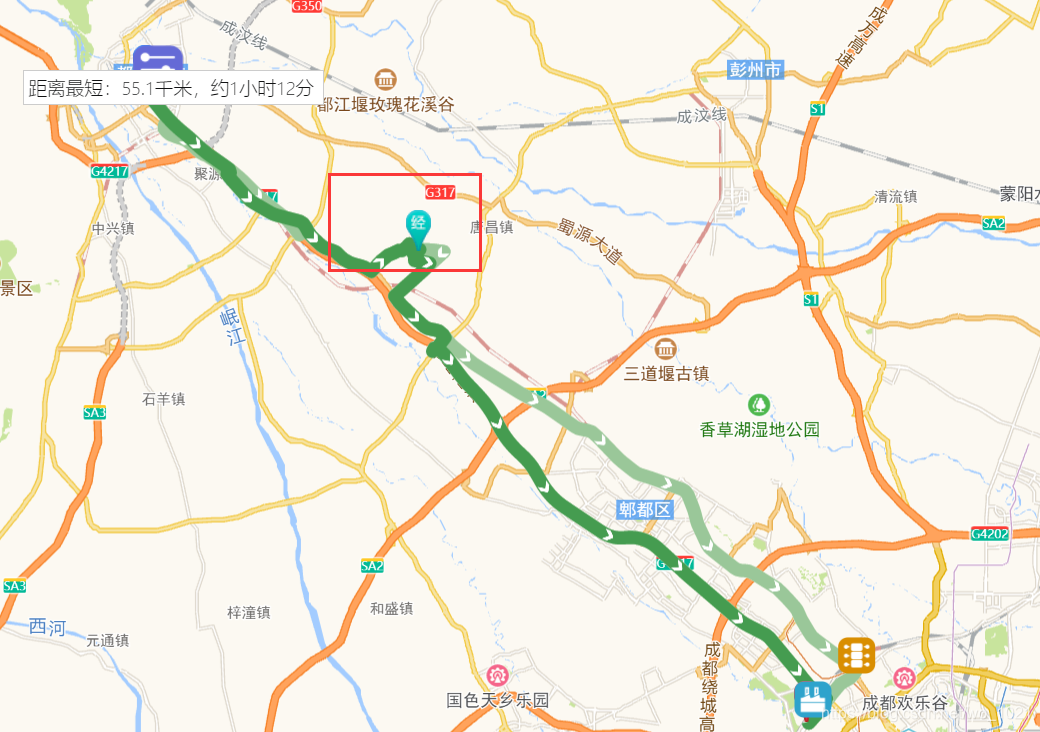
接下来就是想要添加途经点的话,就是在地图上选择一个点作为途经点,添加标记点的方法与起始点类似,就是使用绘图工具在地图上自己点击即可,使用了途经点的图片作为区分,要注意的是,添加好途径点后,要重新渲染路线。
mouseTool.marker({
        zIndex: 200,
        // 将一张图片的地址设置为 icon
        icon: new AMap.Icon({
          // 图标尺寸
          size: new AMap.Size(28, 40),
          // 图标的取图地址
          image: '//a.amap.com/jsapi_demos/static/demo-center/icons/dir-marker.png',
          // 图标所用图片大小
          imageSize: new AMap.Size(135, 40),
          // 图标取图偏移量
          imageOffset: new AMap.Pixel(-50, -3)
        }),
        // 设置了 icon 以后,设置 icon 的偏移量,以 icon 的 [center bottom] 为原点
        offset: new AMap.Pixel(-13, -30)
      })


 1651
1651

 被折叠的 条评论
为什么被折叠?
被折叠的 条评论
为什么被折叠?
 到【灌水乐园】发言


