


注:个人学习笔记,感谢帮忙指出错误
线性回归
1.初始化:随机选择权重w
2.计算此时的损失函数
参数:
特征: 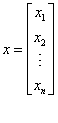
权重 :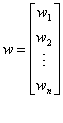
y:实际值
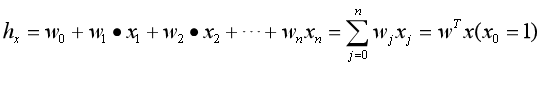
h(x):计算输出
计算输出:
损失函数:
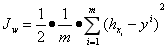
(注:前面0.5是为了求导方便)
3.减少损失函数
目的是计算值与实际值无限接近,也就是损失值越小越好,降低损失值。
方法:
(一)梯度下降法:

重复2 3直到损失函数达到预期值。
代码:
import torch
import matplotlib.pyplot as plt
import os
os.environ[‘KMP_DUPLICATE_LIB_OK’] = ‘TRUE’
torch.manual_seed(10)
lr = 0.05 # 学习率 20191015修改
创建训练数据
x = torch.rand(20, 1) * 10 # x data (tensor), shape=(20, 1) 从0-1均匀分布随机生成201个数字10
y = 2*x + (5 + torch.randn(20, 1)) # y data (tensor), shape=(20, 1) torch。randn 从标准正态分布随机生成
构建线性回归参数
w = torch.randn((1), requires_grad=True) #requires_grad=True是要求精度
b = torch.zeros((1), requires_grad=True) #b初始化为0
for iteration in range(1000):
# 前向传播
wx = torch.mul(w, x)
y_pred = torch.add(wx, b)

# 计算 MSE loss
loss = (0.5 * (y - y_pred) ** 2).mean()#.mean()是求均值

# 反向传播
loss.backward()   #注:细看  15.53先掠过

# 更新参数
b.data.sub_(lr * b.grad)
w.data.sub_(lr * w.grad)

# 清零张量的梯度   20191015增加
w.grad.zero_()
b.grad.zero_()

# 绘图
if iteration % 20 == 0:
    plt.cla()   # 防止社区版可视化时模型重叠2020-12-15
    plt.scatter(x.data.numpy(), y.data.numpy())  #plt.scatter()函数用于生成一个scatter散点图。
    plt.plot(x.data.numpy(), y_pred.data.numpy(), 'r-', lw=5)   #画折线图
    plt.text(2, 20, 'Loss=%.4f' % loss.data.numpy(), fontdict={'size': 20, 'color':  'red'})
    plt.xlim(1.5, 10)
    plt.ylim(8, 28)
    plt.title("Iteration: {}\nw: {} b: {}".format(iteration, w.data.numpy(), b.data.numpy()))
    plt.pause(0.5)

    if loss.data.numpy() < 1:
        break
plt.show()


 4756
4756


 被折叠的 条评论
为什么被折叠?
被折叠的 条评论
为什么被折叠?
 到【灌水乐园】发言


