


本文主要介绍matplotlib中单一颜色的使用、渐变色和色块的定义和使用,渐变色块和线条等。
import numpy as np
import matplotlib.pyplot as plt
from matplotlib import cm
from matplotlib.colors import ListedColormap, LinearSegmentedColormap
单一颜色使用方法
matplotlib中颜色对照可以查看:https://blog.csdn.net/qq_44901949/article/details/124738392
颜色选择可以查看:https://color.adobe.com/zh/create
# 颜色可以通过16进制颜色代码 常用颜色编号 颜色名称 RGBA进行调用
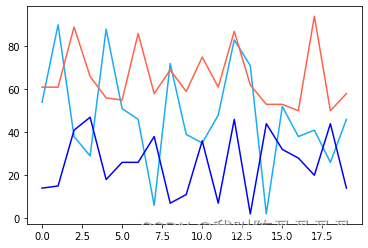
ts = np.random.randint(1,100,20)
ts2 = np.random.randint(1,50,20)
plt.plot(ts,c = '#17ADF2') # 使用16进制颜色代码
plt.plot(ts2,c = 'b') # 使用常用颜色代码 r b 等
plt.plot(np.random.randint(50,100,20),c = 'tomato') # 使用颜色名称
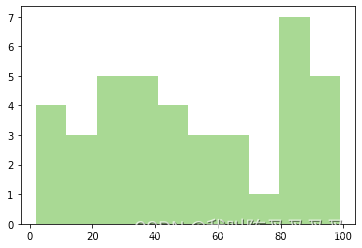
# 使用RBGA需要将数值控制在0-1之间
def set_color(R,G,B,alpha):
    return np.array([R,G,B,255*alpha])/255
plt.hist(ts2,color= set_color(169,217,148,1))
渐变颜色条
# 渐变颜色可以从cm中导入
cm.OrRd
OrRd

under
bad
over
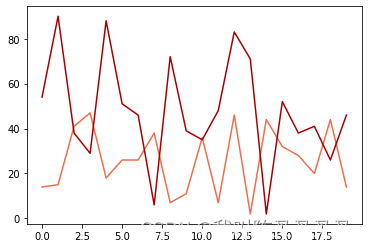
# 渐变条颜色为从0-1的分布 cm.OrRd(x) 可提取中间点某一位置颜色
plt.plot(ts2,c =cm.OrRd(0.6))
plt.plot(ts,c =cm.OrRd(0.9))
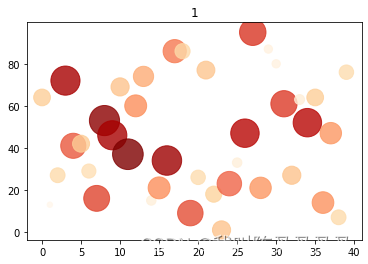
# 使用cmap和c两个参数创建散点图
plt.scatter(x,ts,c = ts2/100,s = ts2 *10,cmap=cm.OrRd,alpha=0.8)
plt.title('1')
# 增加颜色条
plt.scatter(x,ts,c = ts2/100,s = ts2 *10,cmap=cm.BuGn,alpha=0.8)
plt.title('1')
plt.colorbar(
#     orientation='horizontal'
)

# 使用 LinearSegmentedColormap 通过列表自定义渐变条
colors = ["w", "tomato"]
cmap1 = LinearSegmentedColormap.from_list("mycmap", colors)
cmap1
mycmap

under
bad
over
colors = ['#10454F','tomato','#818274']
cmap1 = LinearSegmentedColormap.from_list("mycmap", colors)
cmap1
mycmap

under
bad
over
色阶块
cm.tab20c
tab20c

under
bad
over
# 不同色块的柱状图
plt.bar(x = np.arange(5),height= np.random.randint(1,10,5),color = [cm.tab20c(i) for i in range(5)])

# 自定义色块
ListedColormap(['#10454F','#506266','#818274','#A3AB78'])
from_list

under
bad
over
渐变图形
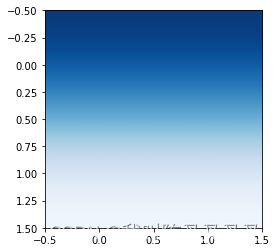
# imshow 创建一个渐变色块
a = np.array([[1, 1],
              [2, 2]])
plt.imshow(a, interpolation='bicubic', cmap=plt.cm.Blues_r)
# 利用imshow创建渐变的图形
fig, ax = plt.subplots()
ax.set(xlim=(0,10), ylim=(0,1), autoscale_on=False)
N = 10
x = np.arange(N) + 0.15
y = np.random.rand(N)
width = 0.4
for x, y in zip(x, y):
    ax.imshow(a, interpolation='bicubic', extent=(x, x+width, 0, y), cmap=plt.cm.Wistia)
ax.set_aspect('auto')
plt.show()

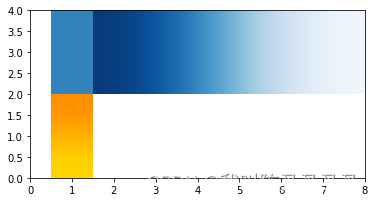
fig, ax = plt.subplots()
ax.set(xlim=(0,8), ylim=(0,4))
ax.imshow(X = np.array([[1],
              [2]]),interpolation='bicubic',cmap=cmap1, extent=(0.5, 1.5, 0, 2) )
ax.imshow(X = np.array([[1,2],[1,2]]),interpolation='bicubic',cmap=cm.Blues_r, extent=(1.5, 8, 2, 4) )
ax.imshow(X = np.array([[1,],[1,]]),interpolation='bicubic',cmap=cm.tab20c, extent=(0.5, 1.5, 2, 4) )
渐变线条
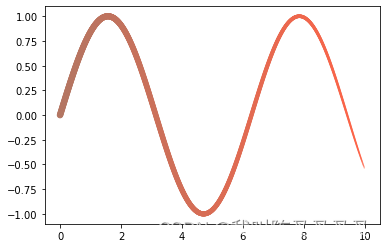
# 使用散点图形成渐变线条
x = np.arange(0,10,0.01)
y = np.sin(x)
cmap2 = LinearSegmentedColormap.from_list('22',[cmap1(0.8),cmap1(0.5)])
cmap2
22

under
bad
over
plt.scatter(x,y,c=x/10,cmap=cmap2,s=(10-x)*3)


 1235
1235


 被折叠的 条评论
为什么被折叠?
被折叠的 条评论
为什么被折叠?
 到【灌水乐园】发言


