- rectangle函数
功能:创建带有尖角或圆角的矩形
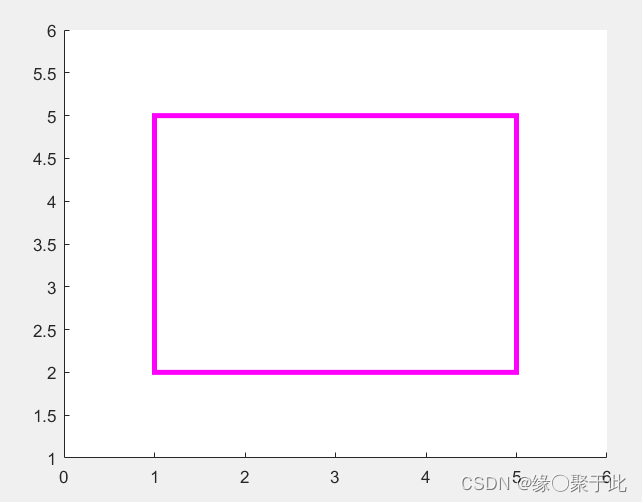
代码如下:
clear;clc;
rectangle('Position',[1,2,4,3],'Linewidth',2,'LineStyle','-','EdgeColor','m')
axis([0 6 1 6])
- plot绘制矩形轨迹
基本思想:首先确定起始坐标点(1,1),按照一定的速度向右水平移动,直至矩形的右下点(7,1);然后按照逆时针方向,向上,向左,向下,依次绘制矩形轨迹的另外三条边即可。
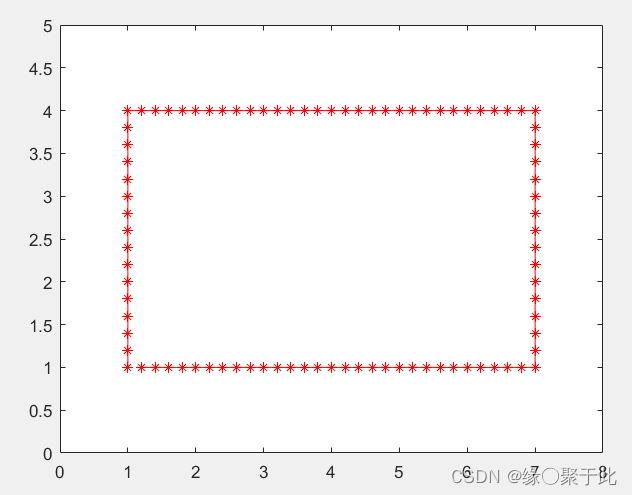
代码如下:
clear;clc;
hx = 1:120;
len = length(hx);
initLabelx = 1;
initLabely = 1;
initVx = 1;
initVy = 0;
for i=1:len
x(i) = hx(i);
if x(i)<=30
out(1,i) = initLabelx + 0.2 * x(i);
out(2,i) = initLabely;
if x(i)==30
initLabelx = out(1,i);
initLabely = out(2,i);
end
elseif x(i)>30 && x(i)<=45
out(1,i) = initLabelx;
out(2,i) = initLabely + 0.2*(x(i)-30);
if x(i)==45
initLabelx = out(1,i);
initLabely = out(2,i);
end
elseif x(i)>45 && x(i)<=75
out(1,i) = initLabelx - 0.2 *(x(i)-45);
out(2,i) = initLabely;
if x(i)==75
initLabelx = out(1,i);
initLabely = out(2,i);
end
elseif x(i)>75 && x(i)<=90
out(1,i) = initLabelx;
out(2,i) = initLabely - 0.2 *(x(i)-75);
if x(i)==95
initLabelx = out(1,i);
initLabely = out(2,i);
end
end
end
figure
plot(out(1,:),out(2,:),'r-*');
axis([0 8 0 5])


 1024
1024


 被折叠的 条评论
为什么被折叠?
被折叠的 条评论
为什么被折叠?
 到【灌水乐园】发言


