


首先介绍一个函数 sparkline , 是一种描述类型的信息图,特点是小尺寸,高数据,并
提供一个简明的趋势。
代码简介:
function sparkline(xdata,ydata,labels1,labels2)
%SPARKLINE(XDATA,YDATA,LABELS1,LABELS2) creates a graph with sparklines
% XDATA and YDATA are cell arrays of vectors of x and corresponding y
% values. LABELS1 give the labels you want corresponding to each sparkline
% to be located at the start of the line. LABELS2 give the labels you want
% corresponding to each sparkline to be located at the end of the line.
% No borders necessary - span the axes out to total available space
% make the plots by bumping up each sparkline with an arbitrary unit of
% separation. Here unitOfSep=1;
unitOfSep=1;
figure; axes('position',[0 0 1 .9]);hold on;
endPt = -1;
startPt = 1e100;
for i = 1:length(xdata)
% Plot SparkLines
plot(xdata{i}, ydata{i}+ (i-1)*+unitOfSep,'k');
maxp{i} = find(ydata{i}==max(ydata{i}));
minp{i} = find(ydata{i}==min(ydata{i}));
plot(xdata{i}(maxp{i}),ydata{i}(maxp{i})+ (i-1)*+unitOfSep,'bo','MarkerFaceColor','b');
plot(xdata{i}(minp{i}),ydata{i}(minp{i})+ (i-1)*+unitOfSep,'ro','MarkerFaceColor','r');
text(xdata{i}(end), mean(ydata{i})+ (i-1)*+unitOfSep,labels1{i},'HorizontalAlignment','right');
text(xdata{i}(1), mean(ydata{i})+ (i-1)*+unitOfSep,labels2{i},'HorizontalAlignment','left');
endPt = max([xdata{i}(1) endPt]);
startPt= min([xdata{i}(end) startPt]);
end
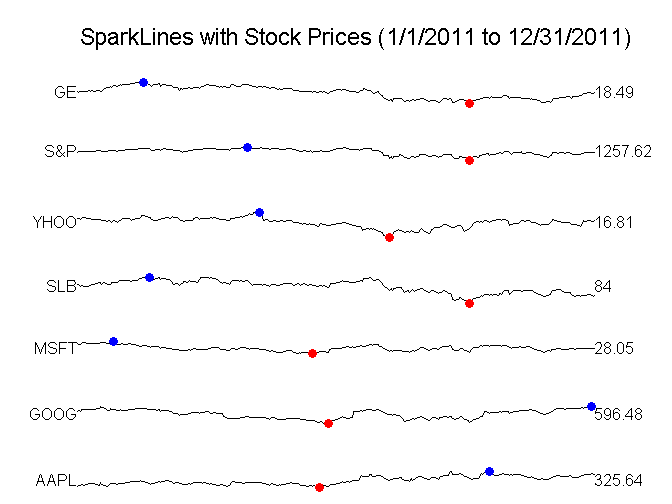
text(startPt+2, i*unitOfSep+.7,'SparkLines with Stock Prices (1/1/2011 to 12/31/2011)','fontsize',14);
set(gca,'visible','off','ylim',[0+unitOfSep/2 i*unitOfSep+unitOfSep/2],...
'yticklabel',[],'xlim',[startPt-.15*(endPt-startPt) endPt+.15*(endPt-startPt)],...
'xticklabel',[],'TickLength',[0 0]);
set(gcf,'Color',[1 1 1],'Paperpositionmode','auto');
主要的部分代码:
stocks = {'AAPL','GOOG','MSFT','SLB','YHOO','S&P','GE'};
rangeMIN = datenum('1/1/2011');
rangeMAX = datenum('12/31/2011');

%% Preprocess
for i = 1:length(dt)
    % Data Processing
    % convert date to a numeric format
    cc={dateD{i}{2:end,1}};
    dateD{i} = datenum({dateD{i}{2:end,1}});
    % find dates in range
    idx = find(dateD{i} >= rangeMIN & dateD{i} <= rangeMAX);
    dt{i} = dt{i}(idx);
    % extract data in range
    dateD{i} = dateD{i}(idx);
    % normalize
    dtn{i} = dt{i}./max(dt{i});
    clear idx
    labels2{i} = num2str(dt{i}(end));
end

%% Call spark lines
sparkline(dateD,dtn,stocks,labels2);
效果图:


 1996
1996

 被折叠的 条评论
为什么被折叠?
被折叠的 条评论
为什么被折叠?
 到【灌水乐园】发言


