


前言
第一次跟A股相识还是在疫情初期,刚开始还是玩的心态,确实也赚到点钱。后来信心爆棚,以为是天选之子,结果一发不可收拾,越加越多,越亏越多。无奈为了回本,就有了这个项目。 最开始本工具只是用于自己使用,后边股友多了才有了公众号。公众号不太好盯盘,借鉴【韭菜盒子】实现了一套vscode盯盘插件,划水必备神器。
项目介绍
投资逻辑
本项目大多数的指标技术都是以价值投资作为底层思想。以波段作为主要投资逻辑。
本项目只做A股量化。
量化策略
目前市面上量化策略主要分为两个方向:
-
以通达信,同花顺等指标公式组成的选股公式。我们称之为统计类的指标。
-
结合人工智能,机器学习作为量化底座。我们称之为数据科学/数据分析。目前基本都是基于LSTM(长短期记忆网络)来做的
项目优点
-
本项目已耗时3年,涵盖了市面上大多数的量化基座。理论上可以无限扩充自定义量化策略。
-
服务器采用gmsec分布式微服务系统,可单服务部署,可集群横向扩展。
-
grpc多端通信,模型功能采用指令,pymsec实现双向通信。
-
前端展示包括:vscode插件,uniapp,vue3。理论上可支持所有web相关联的终端平台,包括小程序,h5,pc等。
关键指标原理解析
微服务启动 【gmsec】
代码:
mylog.SetLog(mylog.GetDefaultZap())
// swagger
myswagger.SetHost("https://localhost:" + config.GetPort())
myswagger.SetBasePath("shares")
myswagger.SetSchemes(true, false)
// event.UPPPP()
// -----end --
// grpc 相关 初始化服务
service := micro.NewService(
	micro.WithName("lp.srv.eg1"),
)
h := new(hello)
proto.RegisterHelloServer(service.Server(), h) // 服务注册
// ----------- end
// gin 相关
base := ginrpc.New(ginrpc.WithCtx(api.NewAPIFunc), ginrpc.WithDebug(dev.IsDev()))
router := gin.Default()
v1 := router.Group("/shares/api/v1")
base.Register(v1, h) // 对象注册
// ------ end
plg, b := plugin.RunHTTP(plugin.WithGin(router),
	// plugin.WithMicro(service),
plugin.WithAddr(":"+config.GetPort()))
if b == nil {
	plg.Wait()
}
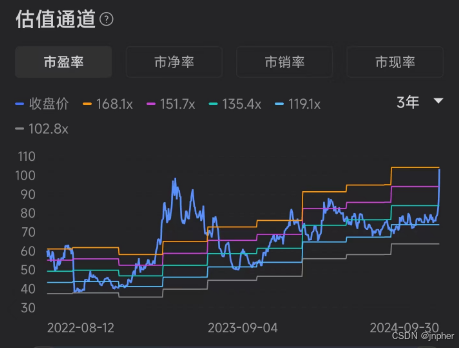
估值通道
估值通道使用5浪理论量化出不同市盈率倍数下的股价曲线,主要用来判断股票历史收益的持续性和当前股价的合理性。若曲线趋势整体向上,则表明公司财务基本面向好。
估值通道灵感来源于同花顺的简况(f10)下的估值通道。
| 同花顺估值通道 | 工具估值通道 |
|
| 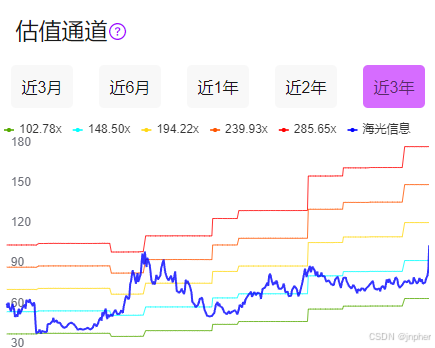 |
源码(获取5条pe线):
var eps float64 // 每股收益
// 获取pe
mp := make(map[int64]float64)
list := serializing.GetSharesDaily(req.Code)
for _, v := range list {
	if v.Day0 >= _day0 {
		// ... ...
		mp[v.Day0] = v.PeTtm
	}
}
var offset float64
if maxPe > 0 {
	offset = (maxPe - minPe) * 0.5 * 0.5
}
for _, v := range out { // 基本数据
	if _, ok := mp[v.Day0]; ok {
		if mp[v.Day0] != 0 {
			eps = v.Value / mp[v.Day0]
		}
	}
	// 股票价格= PE * 每股收益
	resp.Pe0 = append(resp.Pe0, eps*(minPe))
	resp.Pe1 = append(resp.Pe1, eps*(minPe+(1*offset)))
	resp.Pe2 = append(resp.Pe2, eps*(minPe+(2*offset)))
	resp.Pe3 = append(resp.Pe3, eps*(minPe+(3*offset)))
	resp.Pe4 = append(resp.Pe4, eps*(minPe+(4*offset)))
}
if len(resp.Pe1) > 0 {
	resp.Names = append(resp.Names, fmt.Sprintf("%0.2fx", minPe))
	resp.Names = append(resp.Names, fmt.Sprintf("%0.2fx", (minPe+(1*offset))))
	resp.Names = append(resp.Names, fmt.Sprintf("%0.2fx", (minPe+(2*offset))))
	resp.Names = append(resp.Names, fmt.Sprintf("%0.2fx", (minPe+(3*offset))))
	resp.Names = append(resp.Names, fmt.Sprintf("%0.2fx", (minPe+(4*offset))))
}
人工智能应用
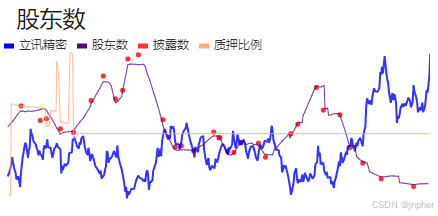
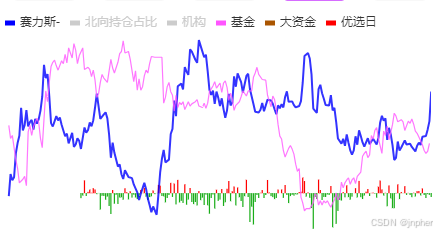
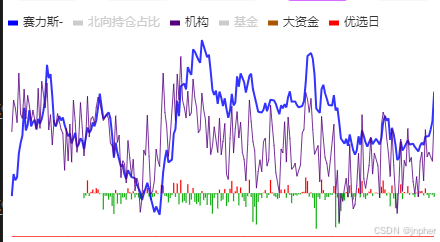
项目提供日线级别的股东数、公募持仓、机构持仓。数据底层采用【LSTM】实现。
-
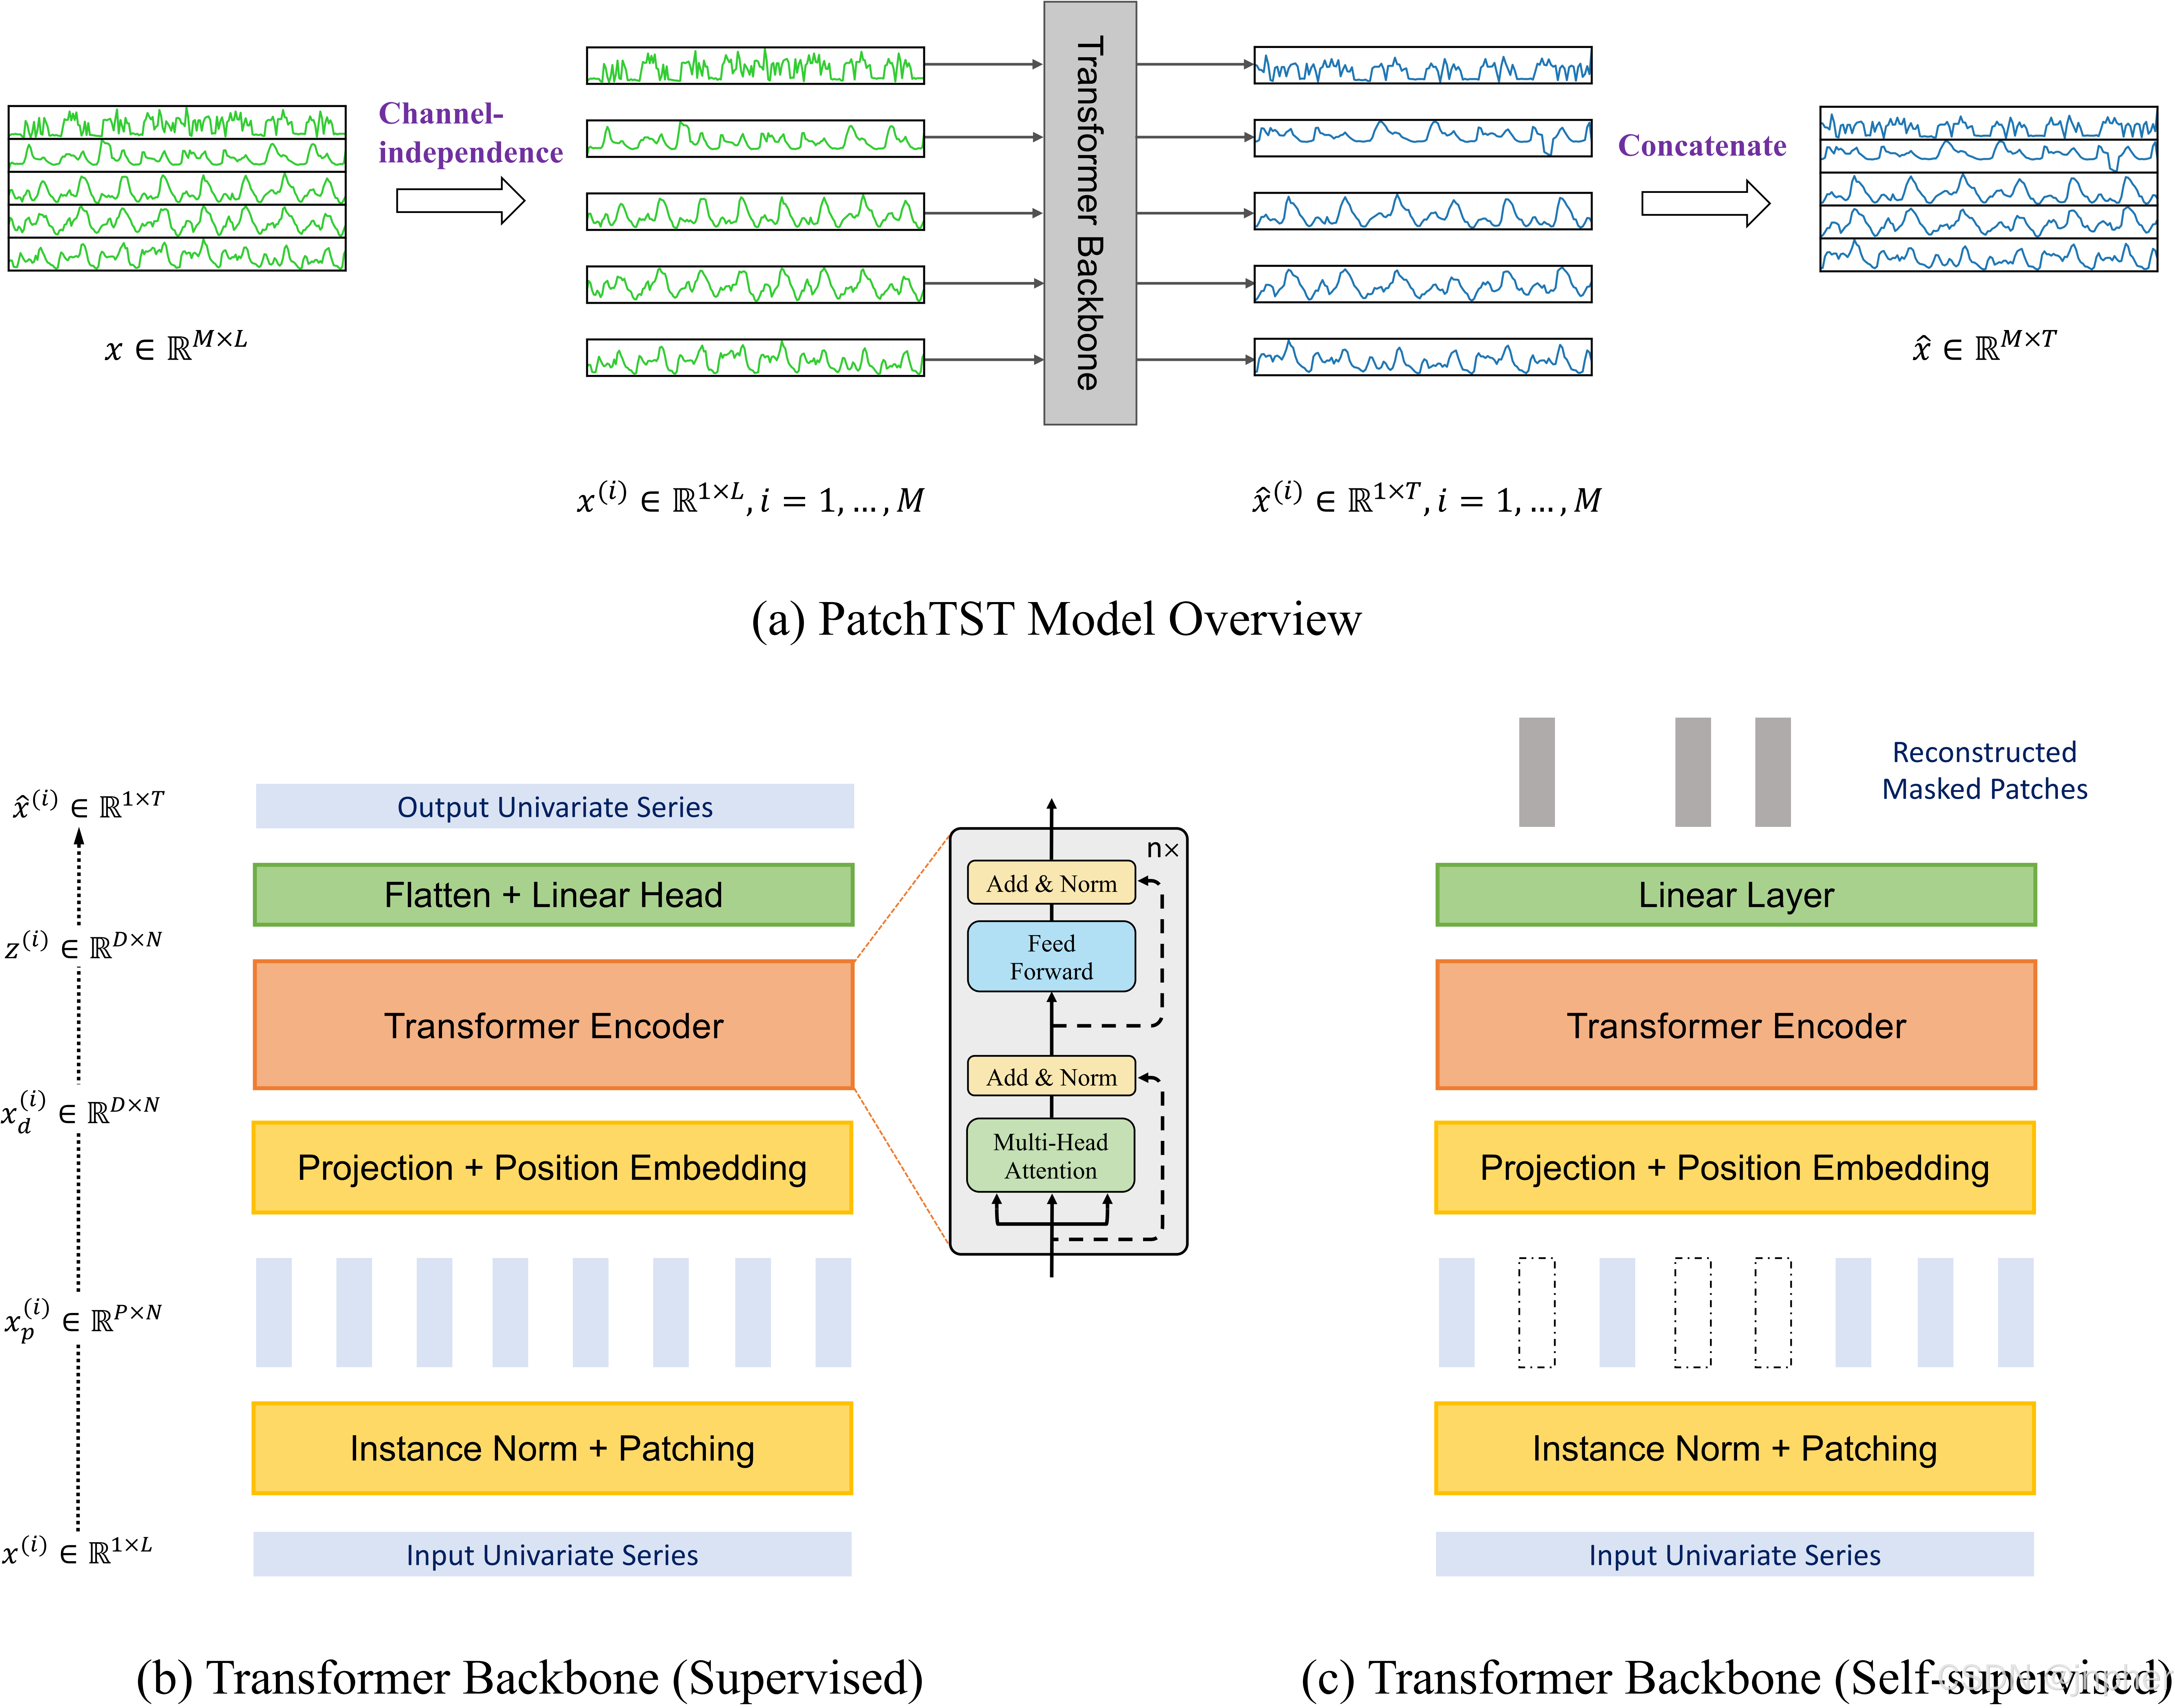
公募,机构,股东数采用【PatchTST】做的无监督学习,基于独立策略学习,每只股票一个模型。
PatchTST模型是一种基于卷积网络(CNN)的深度学习模型,它通过捕捉股票价格的时空特征,提高了预测精度。 PatchTST将股票价格数据表示为时空图(STG),并利用图卷积网络(GCN)进行特征提取和预测。
代码-预训练:
def find_lr():
    dls = get_dls(args)
    model = get_model(dls.vars, args)
    # get loss
    loss_func = torch.nn.MSELoss(reduction='mean')
    # get callbacks
    cbs = [RevInCB(dls.vars, denorm=False)] if args.revin else []
    cbs += [PatchMaskCB(patch_len=args.patch_len, stride=args.stride, mask_ratio=args.mask_ratio)]

    # define learner
    learn = Learner(dls, model,
                        loss_func,
                        lr=args.lr,
                        cbs=cbs,
                        )
    # fit the data to the model
    suggested_lr = learn.lr_finder()
    print('suggested_lr', suggested_lr)
    return suggested_lr


def pretrain_func(lr=args.lr):
    # get dataloader
    dls = get_dls(args)
    # get model
    model = get_model(dls.vars, args)
    # get loss
    loss_func = torch.nn.MSELoss(reduction='mean')
    # get callbacks
    cbs = [RevInCB(dls.vars, denorm=False)] if args.revin else []
    cbs += [
         PatchMaskCB(patch_len=args.patch_len, stride=args.stride, mask_ratio=args.mask_ratio),
         SaveModelCB(monitor='valid_loss', fname=args.save_pretrained_model,
                        path=args.save_path)
        ]
    # define learner
    learn = Learner(dls, model,
                        loss_func,
                        lr=lr,
                        cbs=cbs,
                        #metrics=[mse]
                        )
    # fit the data to the model
    learn.fit_one_cycle(n_epochs=args.n_epochs_pretrain, lr_max=lr)

    train_loss = learn.recorder['train_loss']
    valid_loss = learn.recorder['valid_loss']
    df = pd.DataFrame(data={'train_loss': train_loss, 'valid_loss': valid_loss})
    df.to_csv(args.save_path + args.save_pretrained_model + '_losses.csv', float_format='%.6f', index=False)
测试模型:
def test_func():
    weight_path = args.save_path + args.save_model_name + '.pth'
    # get dataloader
    dls = get_dls(args)
    model = get_model(dls.vars, args)
    #model = torch.load(weight_path)
    # get callbacks
    cbs = [RevInCB(dls.vars)] if args.revin else []
    cbs += [PatchCB(patch_len=args.patch_len, stride=args.stride)]
    learn = Learner(dls, model,cbs=cbs)
    out  = learn.test(dls.test, weight_path=weight_path, scores=[mse,mae])         # out: a list of [pred, targ, score_values]
    return out
股东数:
公募:
机构:
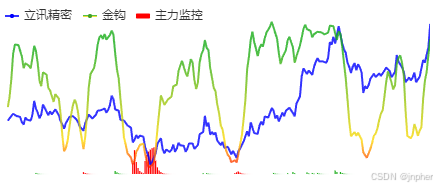
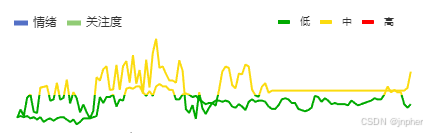
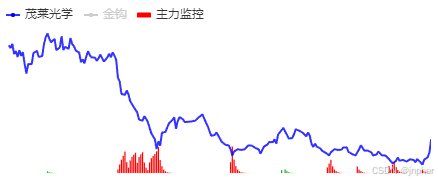
优选日:
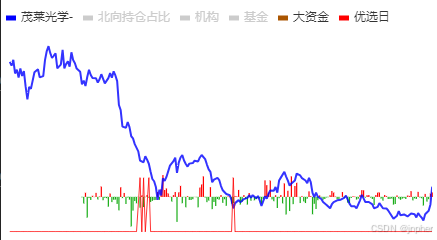
- 通过消息抓取,采用【HanLP】实现消息中情绪挖掘。再借鉴10%的顶底,实现股票的情绪。再结合通达信指标中的主力监控,共同实现金钩策略。
代码示例:
      import hanlp

      # 安装HanLP
      !pip install hanlp

      # 加载情感分析模型
      classifier = hanlp.load('sdp/sentiment/afp_sentiment.sdp').SentimentClassifier

      # 读取文本
      text = "这部电影真是太棒了!"

      # 进行情感分析
      result = classifier(text)

      # 输出结果
      print("情感倾向:", result)
金钩:
情绪:
通达信指标公式
- 项目中通达信指标,或者现在的市面上很多模型公式,以及量化工具,采用开源项目【Ashare】和 【MyTT_plus】 实现其中的主力真吸货,飞鹰优选,风险等指标。
飞鹰优选
# 飞鹰优选
VAR1 = CLOSE / MA(CLOSE, 40) * 100 < 78;
VAR2 = CLOSE / MA(CLOSE, 60) * 100 < 74;
VAR3 = HIGH > LOW * 1.051;
VAR4 = VAR3 & (COUNT(VAR3, 5) > 1);
TYP = (HIGH + LOW + CLOSE) / 3;
CCI = (TYP - MA(TYP, 14)) / (0.015 * AVEDEV(TYP, 14));
T1 = (MA(CLOSE, 27) > 1.169*CLOSE) & (MA(CLOSE, 17) > 1.158*CLOSE);
T2 = (CLOSE < MA(CLOSE, 120)) & (MA(CLOSE, 60) < MA(CLOSE, 120)) & (MA(CLOSE, 60) > MA(CLOSE, 30)) & (CCI > -210);
FYYH = VAR4 & (VAR1 | VAR2) & T1 & T2;
XG = BARSLASTCOUNT(FYYH) == 1;
df['fyyx'] = XG
主力真吸货
VAR1 = REF(LOW,1);
VAR2 = SMA(ABS(LOW-VAR1),3,1)/SMA(MAX(LOW-VAR1,0),3,1)*100;
VAR3 = EMA(IF(CLOSE*1.2,VAR2*10,VAR2/10),3);
VAR4 = LLV(LOW,38);
VAR5 = HHV(VAR3,38);
VAR6 = IF(LLV(LOW,90),1,0);
VAR7 = EMA(IF(LOW<=VAR4,(VAR3+VAR5*2)/2,0),3)/618*VAR6;
VAR8 = ((CLOSE-LLV(LOW,21))/(HHV(HIGH,21)-LLV(LOW,21)))*100;
VAR9 = SMA(VAR8,13,8);
ZLZXH =  VAR7 # 主力吸货
df['zlzxh'] = ZLZXH
极低涨/生命线
# 极低涨指标
VA1 = HHV(HIGH,9)-LLV(LOW,9);
VA2 = HHV(HIGH,9)-CLOSE;
VA3 = CLOSE-LLV(LOW,9);
VA4 = VA2/VA1*100-70;
VA5 = (CLOSE-LLV(LOW,60))/(HHV(HIGH,60)-LLV(LOW,60))*100;
VA6 = (2*CLOSE+HIGH+LOW)/4;
VA7 = SMA(VA3/VA1*100,3,1);
VA8 = LLV(LOW,34);
VA9 = SMA(VA7,3,1)-SMA(VA4,9,1);
VARA = IF(VA9>100,VA9-100,0);
VARB = HHV(HIGH,34);
VARC = EMA((VA6-VA8)/(VARB-VA8)*100,13);
VARD = EMA(0.667*REF(VARC,1)+0.333*VARC,2);
smx = EMA(VARD,1); # 生命线
df['smx'] = smx
多指标结合
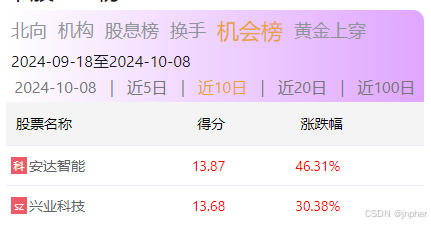
-
通过多个指标及数据结合,拟合出来的右侧启动指标(黄金上穿)实现了系统中的优选日,机会榜等。
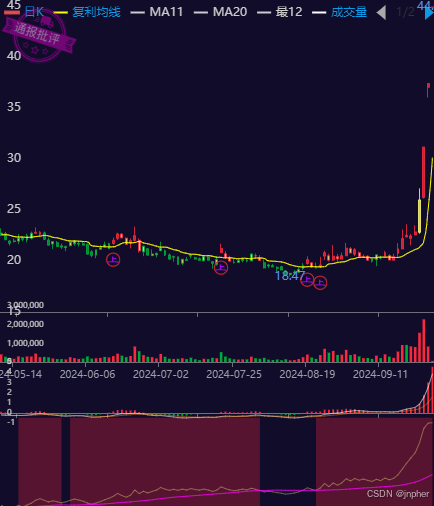
-
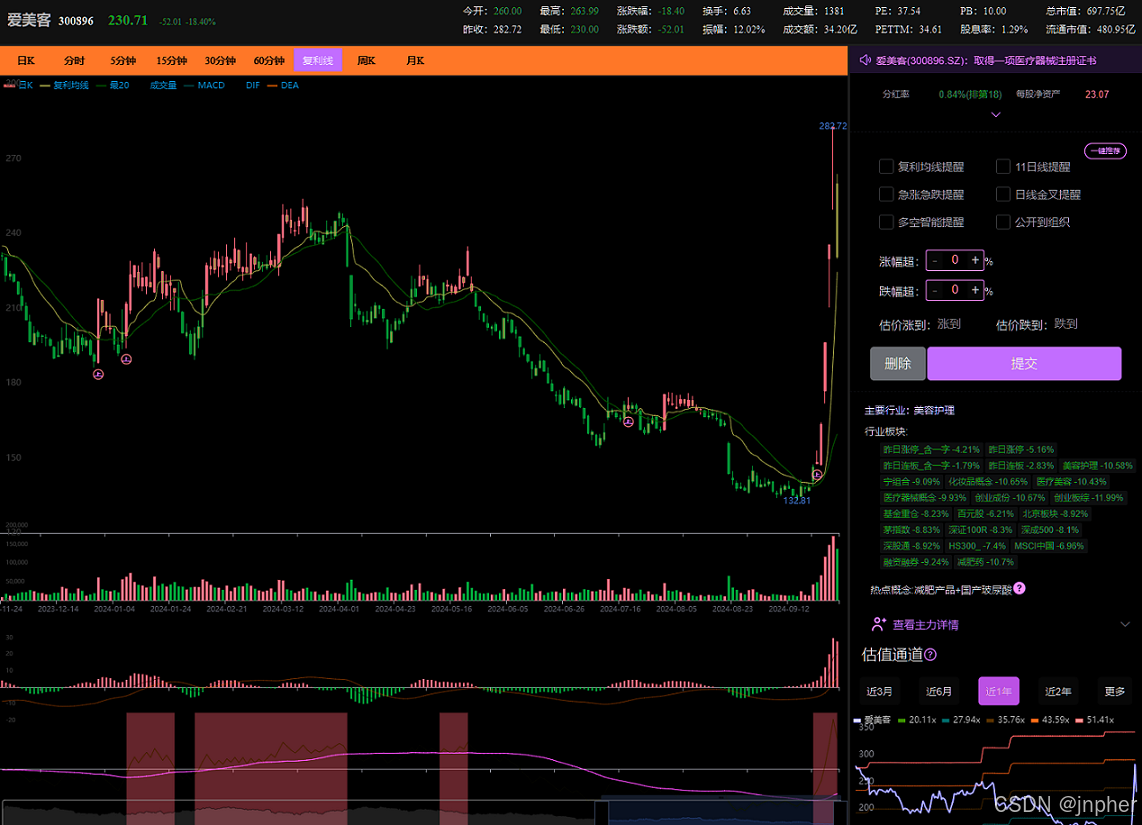
K线中的复利线采用PatchTST叠加hotwinter最佳均线模型,其主要思想是利用加权平均的方法对数据进行组合,以获得更准确的预测结果。主要包含三个部分:k线平滑、噪点调整和周期性调整。有点像是支撑位压力位,但是比支撑压力位更为精准有效。
-
复利k线再叠加黄金上穿,其中黄金上穿使用了系统几乎所有指标,叠加均值求和,以80%作为置信度起点设置置信区间。最终获得一个标签,用来设置黄金上穿。
hotwinter:
def holtWinters(ts, p, sp, ahead, mtype, alpha = None, beta = None, gamma = None):

    a, b, s = _initValues(mtype, ts, p, sp)

    if alpha == None or beta == None or gamma == None:
        ituning   = [0.1, 0.1, 0.1]
        ibounds   = [(0,1), (0,1), (0,1)]
        optimized = fmin_l_bfgs_b(_MSD, ituning, args = (mtype, ts, p, a, b, s[:]), bounds = ibounds, approx_grad = True)
        alpha, beta, gamma = optimized[0]

    MSD, params, smoothed = _expSmooth(mtype, ts, p, a, b, s[:], alpha, beta, gamma)
    predicted = _predictValues(mtype, p, ahead, params)

    return {'alpha': alpha, 'beta': beta, 'gamma': gamma, 'MSD': MSD, 'params': params, 'smoothed': smoothed, 'predicted': predicted}

def _initValues(mtype, ts, p, sp):

    initSeries = pd.Series(ts[:p*sp])
    if mtype == 'additive':
        rawSeason = initSeries - initSeries.rolling(window=p, min_periods=p, center=True).mean()
        initSeason = [np.nanmean(rawSeason[i::p]) for i in range(p)]
        initSeason = pd.Series(initSeason) - np.mean(initSeason)
        deSeasoned = [initSeries[v] - initSeason[v % p] for v in range(len(initSeries))]
    else:
        rawSeason  = initSeries / initSeries.rolling(window = p, min_periods = p, center = True).mean()
        initSeason = [np.nanmean(rawSeason[i::p]) for i in range(p)]
        initSeason = pd.Series(initSeason) / math.pow(np.prod(np.array(initSeason)), 1/p)
        deSeasoned = [initSeries[v] / initSeason[v % p] for v in range(len(initSeries))]

    lm = linear_model.LinearRegression()
    lm.fit(pd.DataFrame({'time': [t+1 for t in range(len(initSeries))]}), pd.Series(deSeasoned))
    return float(lm.intercept_), float(lm.coef_), list(initSeason)
大语言模型:金融Chat
-
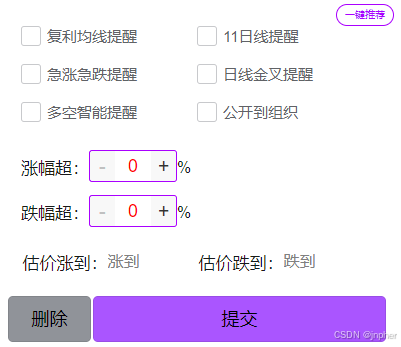
接入微信公众平台消息模板提醒,实现实时提醒功能。设置提醒之后,就相当于自动盯盘了。
-
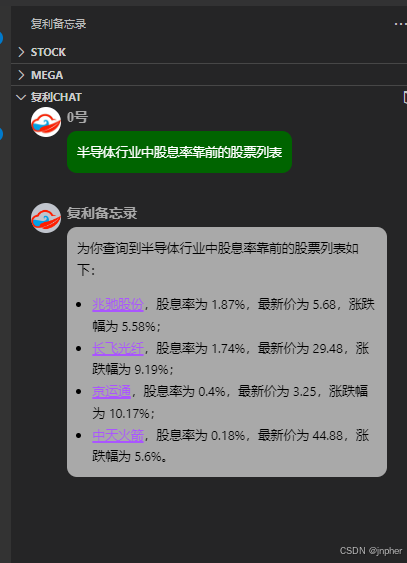
工具中的复利Chat使用了ChatGpt实现了一个金融小模型。其中股票信息通过embedding存储到Milvus中,使用NER/NPR实现属性识别
-
通过火山引擎提供的FunctionCall大模型,实现nlp to action。
-
现已接入抖音coze ai。(贴图)


前端技术
-
本项目中所有图表来自echarts,包括k线图、分时图、板块移动等。
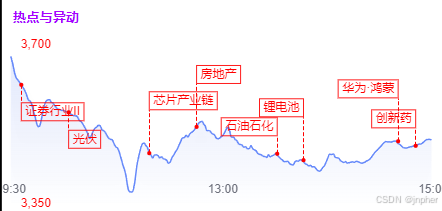
其实我本身是后端出生,所以很多ui纯靠现学。就拿最近做的"分时热点与异动"图,目前我在网上没有搜索到解决方案。我们就以它为例,
纯靠echats完成:
option代码实现:
option = { xAxis: { type: 'value' }, yAxis: { type: 'value' }, series: [ { data: [[10,150], [20,230], [30,224], [40,218], [50, 135], [60, 147], [70, 260]], type: 'line', markLine: { silent:true, label: { show: true, distance: 10, formatter: (param) => { return `{a|${param.name}}`; }, align:'left', rich: { a: { height: 18, lineHeight: 0, borderWidth: 0.5, padding: [0, 4, 0, 4], } } }, symbol: 'none', data: [ [ { symbol: 'circle', name: '内控值:' + 180, coord:[10, 150], lineStyle:{ color:'red' } }, { coord:[10, 120], label:{ rich: { a: { color: 'red', borderColor: 'red', } } } } ], [ { symbol: 'circle', name: '内控值:' + 180, coord:[20, 230], lineStyle:{ color:'green' } }, { coord:[20, 250], label:{ rich: { a: { color: 'green', borderColor: 'green', } } }, } ] ] } } ] };以上代码直接在echarts官网示例粘贴查看效果:Examples - Apache ECharts
没有找到网络上实现方案,如有更好的方案,请不吝赐教。
-
vscode插件
vscode插件灵感来自【韭菜盒子】,下表列出插件功能对比
| 复利备忘录 | 韭菜盒子 |
 |  |
| 功能列表 | 复利备忘录 | leek-fund |
|---|---|---|
| 实时涨跌 | ✔ | ✔ |
| A股/港股/基金 | ✔ | ✔ |
| 美股,期货 | ✖ | ✔ |
| 底部状态栏信息 | ✔ | ✔ |
| 状态栏数量 | 4 | 3 |
| 升序/降序排序 | ✔ | ✔ |
| 公众号同步 | ✔ | ✖ |
| 微信提醒 | ✔ | ✖ |
| 主力分时净流入 | ✔ | ✖ |
| 中意榜 | ✔ | ✖ |
| 黄金上穿 | ✔ | ✖ |
| 一眼清 | ✔ | ✖ |
| 指数榜 | ✔ | ✖ |
| 模糊搜索 | ✔ | ✖(已无效) |
| 设置涨跌颜色 | ✔ | ✔ |
| 复利线(量化k线) | ✔ | ✖ |
| 估值通道 | ✔ | ✖ |
| 日频股东数,公募 | ✔ | ✖ |
| 情绪/股息/北向 | ✔ | ✖ |
| PEG/分红/回购 | ✔ | ✖ |
| 增减持/大宗/龙虎榜 | ✔ | ✖ |
| 其他量化指标 | ✔ | ✖ |
| 金融大模型 | ✔ | ✖ |
| AI一键诊断 | ✔ | ✖ |
插件使用ts开发,因为大量使用ifream,其中编辑栏跟侧边栏通讯比较难解决,最终我们寻找到一个解决方案, 最主要的技术点是webview跟插件本身的逻辑交互逻辑(也就是正文栏与左边栏的交互逻辑),使用postMessage实现通信。
1:在web/pc端(element下),添加postMessage消息,往父节点发送消息
document.addEventListener('click', (e) => {
    if (e.target.dataset.id) {
        window.parent.postMessage({
            type: 'code',
            code: e.target.dataset.id,
            name: e.target.innerText
        }, '*');
    }
})
2:在ifream中接收消息(vscode下代码)并且把消息再往父节点发送转发到webview
 const vscode =acquireVsCodeApi(); //acquireVsCodeApi canonly be invoked once。这一句很重要,必须加上,否则无法识别vscode
 window.addEventListene('message', functio(event) {
     vscode.postMessage({
         type: event.datatype,
         code: event.datacode,
         name:event.dataname,
         url:event.data.url,
     })
 }, false);
3:在vscode 的 webview中接收消息
webviewView.webview.onDidReceiveMessage(data=> {
  switch (data.type) {
    case 'code':
      {
        stockTrend(data.code, data.name, datacode);
        break
      }
    case 'home':
      {
        homeTrend(data.url);
        break
      }
    case 'user':
      {
        this.updateUser();
        break
      }
  }
});}
在线体验
写在最后
最后给即将进入股市的新朋友几条建议:
1,炒股第一课先学会止损。(这个最重要)
2,坚决止损,移动止盈。
3,别借钱,贷款炒股。尽量别融资炒股。
4,心态很重要。all in不可取。
5,长期,分散,核心,价值。
6,牛市本金不要倒金字塔,控制资金幅度


 2442
2442

 被折叠的 条评论
为什么被折叠?
被折叠的 条评论
为什么被折叠?
 到【灌水乐园】发言


