


生成点数据:
from sklearn.neighbors import NearestNeighbors
import numpy as np
import random
import matplotlib.pyplot as plt
points_num = 10
points = np.random.rand(points_num,2)
points_x = points[:,0]
points_y = points[:,1]
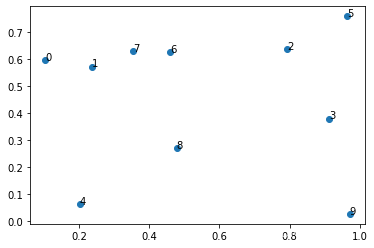
plt.scatter(points_x,points_y)
for i in range(len(points_y)):
plt.annotate(str(i),xy=(points_x[i],points_y[i]),xytext=(points_x[i],points_y[i]))
plt.show()
代码中的plt.annotate是标注文字,xy是标注的坐标,xytext是文字的坐标
点数据可视化:
拟合k近邻
neighbors = NearestNeighbors(n_neighbors=4, algorithm='kd_tree', leaf_size=1200)
neighbors.fit(points)
使用K近邻
distance,indices = neighbors.kneighbors()
print(distance)
print(indices)
(第一行代码的括号里可以指定只寻找某些点的K紧邻。格式是[[x1,y1],...] )
输出:
[[0.1348593  0.25319969 0.35646055 0.49604238]
 [0.13080087 0.1348593  0.22875241 0.38687666]
 [0.20784907 0.28420635 0.3349323  0.43888183]
 [0.28420635 0.35792114 0.38245923 0.44778714]
 [0.34451579 0.51023162 0.54141036 0.58520109]
 [0.20784907 0.38245923 0.52112811 0.62189142]
 [0.10406995 0.22875241 0.3349323  0.35646055]
 [0.10406995 0.13080087 0.25319969 0.37881862]
 [0.34451579 0.35679362 0.37881862 0.38687666]
 [0.35792114 0.54976767 0.63662035 0.73212704]]
[[1 7 6 8]
 [7 0 6 8]
 [5 3 6 7]
 [2 9 5 8]
 [8 1 0 7]
 [2 3 6 7]
 [7 1 2 0]
 [6 1 0 8]
 [4 6 7 1]
 [3 8 2 5]]
输出含义:
- distance:是每个点的离它最近的k个点的距离,是欧式距离
-
indices: 离每个点最近的k个点的索引


 3943
3943


 被折叠的 条评论
为什么被折叠?
被折叠的 条评论
为什么被折叠?
 到【灌水乐园】发言


