实验环境:Anaconda-> Jupyter
参考数据:利用python进行数据分析
python版本 3.5.2
所有的源文件和所需的数据地址是http://download.csdn.net/detail/liangjbdd/8842239#comment
path='C:\\Users\\ecaoyng\\Desktop\\work space\\Python\\py_for_analysis\\pydata-book-master\\ch02\\usagov_bitly_data2012-03-16-1331923249.txt'
open(path).readline()
也可以用JSON列表,loads函数,注意地址分隔符要转义
import json
path='C:\\Users\\ecaoyng\\Desktop\\work space\\Python\\py_for_analysis\\pydata-book-master\\ch02\\usagov_bitly_data2012-03-16-1331923249.txt'
records=[json.loads(line) for line in open(path)]
print (records[0])
print (type(records))
{‘gr’: ‘MA’, ‘u’: ‘http://www.ncbi.nlm.nih.gov/pubmed/22415991‘, ‘cy’: ‘Danvers’, ‘h’: ‘wfLQtf’, ‘hh’: ‘1.usa.gov’, ‘r’: ‘http://www.facebook.com/l/7AQEFzjSi/1.usa.gov/wfLQtf‘, ‘a’: ‘Mozilla/5.0 (Windows NT 6.1; WOW64) AppleWebKit/535.11 (KHTML, like Gecko) Chrome/17.0.963.78 Safari/535.11’, ‘al’: ‘en-US,en;q=0.8’, ‘ll’: [42.576698, -70.954903], ‘hc’: 1331822918, ‘nk’: 1, ‘tz’: ‘America/New_York’, ‘c’: ‘US’, ‘l’: ‘orofrog’, ‘g’: ‘A6qOVH’, ‘t’: 1331923247}
records[0]['tz']‘America/New_York’
列表推导式:
timezones=[rec['tz'] for rec in records if 'tz' in rec]
timezones[:10]
[‘America/New_York’,
‘America/Denver’,
‘America/New_York’,
‘America/Sao_Paulo’,
‘America/New_York’,
‘America/New_York’,
‘Europe/Warsaw’,
”,
”,
”]
def get_counts(seq):
    counts={}
    for x in seq:
        if x in counts:
            counts[x] +=1
        else:
            counts[x]=1
    return counts

get_counts(timezones)
用python代码对时区进行计数:
传统python:
def get_counts(seq):
    counts={}
    for x in seq:
        if x in counts:
            counts[x] +=1
        else:
            counts[x]=1
    return counts

get_counts(timezones)
也可以用defaultdict,将dic的初始值设置为0
from collections import defaultdict
def get_counts2(seq):
    counts=defaultdict(int) # Init with 0
    for x in seq:
        counts[x]+=1
    return counts

tztimes=get_counts2(timezones)len(timezones)3440
tztimes.items()ict_items([(”, 521), (‘Europe/Uzhgorod’, 1), (‘Asia/Pontianak’, 1), (‘Europe/Brussels’, 4), (‘America/Mazatlan’, 1), (‘America/Monterrey’, 1), (‘Asia/Dubai’, 4), (‘Europe/Bratislava’, 3), (‘Asia/Jerusalem’, 3), (‘Europe/Rome’, 27), (‘Asia/Kuala_Lumpur’, 3), (‘America/Indianapolis’, 20), (‘Europe/Lisbon’, 8), (‘Europe/Volgograd’, 1), (‘America/Montevideo’, 1), (‘Europe/Skopje’, 1), …
如果想要得到前十位的时区,用字典的处理技巧:
def top_counts(count_dict,n=10):
    value_key_pairs=[(count,tz)for tz,count in count_dict.items()]
    value_key_pairs.sort()
    return value_key_pairs[-n:]

top_counts(tztimes)
[(‘America/New_York’, 1251),
(”, 521),
(‘America/Chicago’, 400),
(‘America/Los_Angeles’, 382),
(‘America/Denver’, 191),
(‘Europe/London’, 74),
(‘Asia/Tokyo’, 37),
(‘Pacific/Honolulu’, 36),
(‘Europe/Madrid’, 35),
(‘America/Sao_Paulo’, 33)]
也可以用标准库中的collections.Counter
from collections import Counter
counts=Counter(timezones)
counts.most_common(10)
[(‘America/New_York’, 1251),
(”, 521),
(‘America/Chicago’, 400),
(‘America/Los_Angeles’, 382),
(‘America/Denver’, 191),
(‘Europe/London’, 74),
(‘Asia/Tokyo’, 37),
(‘Pacific/Honolulu’, 36),
(‘Europe/Madrid’, 35),
(‘America/Sao_Paulo’, 34)]
用pandas对时区进行计数
DataFrame用于将数据表示成一个表格
from pandas import DataFrame, Series
import pandas as pd; import numpy as np
frame=DataFrame(records)
frame
若不按顺序查看
frame['tz'][:10]0 America/New_York
1 America/Denver
2 America/New_York
3 America/Sao_Paulo
这里frame的输出是摘要视图,主要用于较大的DataFrame对象。frame[‘tz’]所返回的Series对象有一个value_counts方法可以得到需要的值
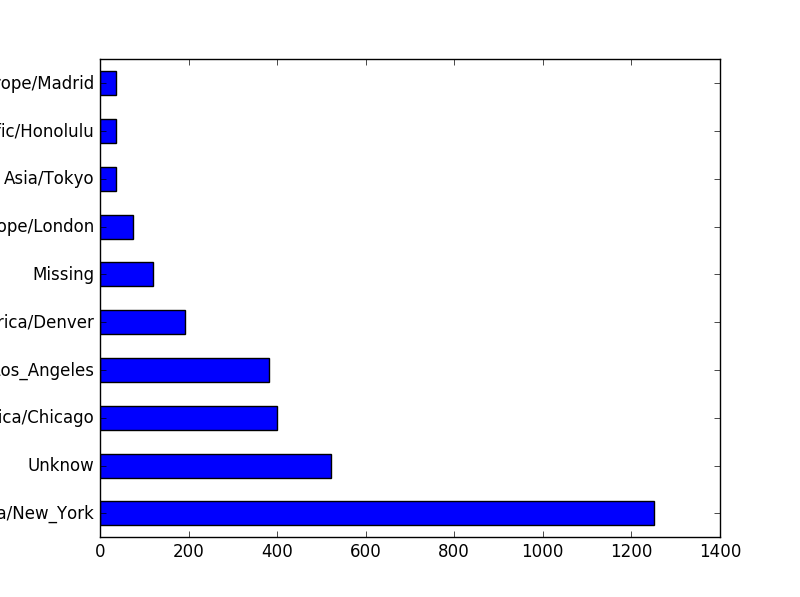
frame['tz'].value_counts()若此时想用matplotlib生成一张图片,需要先将未知或者缺失的时区填上一个替代值。fillna可以替代缺失值,空字符串则可以通过布尔型数组索引加以替换。
clean_tz=frame['tz'].fillna('Missing')
clean_tz[clean_tz== ''] = 'Unknow'
tz_counts=clean_tz.value_counts()
tz_counts[:10]
America/New_York 1251
Unknow 521
America/Chicago 400
America/Los_Angeles 382
America/Denver 191
Missing 120
Europe/London 74
Asia/Tokyo 37
Pacific/Honolulu 36
Europe/Madrid 35
Name: tz, dtype: int64
利用plot方法可以得到水平条形图
当然你要打开pylab
打开方法:
%pylabUsing matplotlib backend: Qt5Agg
Populating the interactive namespace from numpy and matplotlib
tz_counts[:10].plot(kind='barh',rot=0)比如取frame的一列
frame['a']
type(frame['a'])
得到:
0 Mozilla/5.0 (Windows NT 6.1; WOW64) AppleWebKi…
1 GoogleMaps/RochesterNY
2 Mozilla/4.0 (compatible; MSIE 8.0; Windows NT …
3 Mozilla/5.0 (Macintosh; Intel Mac OS X 10_6_8)…
…
pandas.core.series.Series
比如要将agent字符串的第一节分离出来并得到另外一份用户行为摘要
results=Series([x.split()[0] for x in frame.a.dropna()])
results[:5]
0 Mozilla/5.0
1 GoogleMaps/RochesterNY
2 Mozilla/4.0
3 Mozilla/5.0
4 Mozilla/5.0
dtype: object
results.value_counts()[:8]Mozilla/5.0 2594
Mozilla/4.0 601
GoogleMaps/RochesterNY 121
Opera/9.80 34
TEST_INTERNET_AGENT 24
GoogleProducer 21
Mozilla/6.0 5
BlackBerry8520/5.0.0.681 4
dtype: int64
假如你想按windows和非windows用户来区分时区的统计信息。为了简单,假如agent字符串中含有windows就认为是windows用户,由于有些agent缺失,所以先移除
cframe=frame[frame.a.notnull()]
operating_system=np.where(cframe['a'].str.contains('Windows'), 'Windows', 'Not Windows')
operating_system[:5]
array([‘Windows’, ‘Not Windows’, ‘Windows’, ‘Not Windows’, ‘Windows’],
dtype=’
print (len(cframe))
by_tz_os=cframe.groupby(['tz'])
by_tz_os.size()
输出
3440
tz
521
Africa/Cairo 3
Africa/Casablanca 1
Africa/Ceuta 2
Africa/Johannesburg 1
Africa/Lusaka 1
America/Anchorage 5
America/Argentina/Buenos_Aires 1
…
dtype: int64
为了计算是否和cframe的值相等
by_tz_os.size().sum()3440
unstack 可以使一列数据设置为列标签
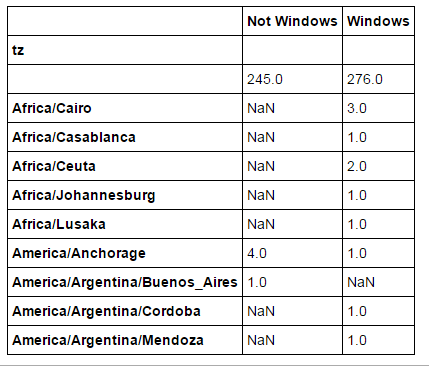
agg_counts=by_tz_os.size().unstack()
agg_counts[:10]

agg_counts=agg_counts.fillna(0)
agg_countsagg_counts['Not Windows'].sum(0)1194.0
agg_counts.loc['Pacific/Honolulu']Not Windows 0.0
Windows 36.0
Name: Pacific/Honolulu, dtype: float64
indexer=agg_counts.sum(1).loc['Pacific/Honolulu']
indexer
36.0
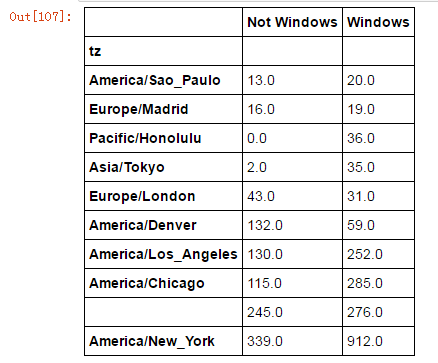
count_subset=agg_counts.take(indexer)[-10:]
count_subset
最后来选取最常出现的时区
take的作用官方文档是Analogous to ndarray.take(百度)
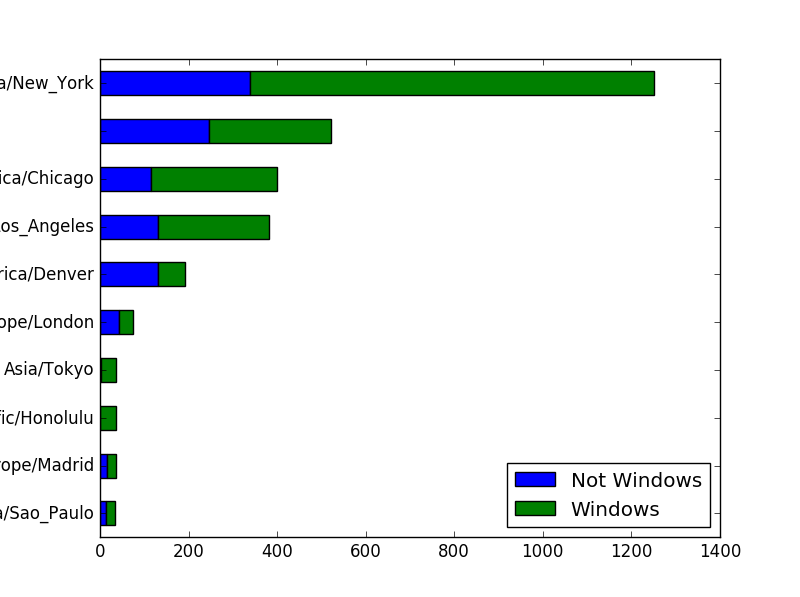
作图:
count_subset.plot(kind='barh',stacked=True)from pandas import DataFrame #从pandas库中引用DataFrame
df_obj = DataFrame() #创建DataFrame对象
df_obj.dtypes #查看各行的数据格式
df_obj.head() #查看前几行的数据,默认前5行
df_obj.tail() #查看后几行的数据,默认后5行
df_obj.index #查看索引
df_obj.columns #查看列名
df_obj.values #查看数据值
df_obj.describe #描述性统计
df_obj.T #转置
df_obj.sort(columns = ‘’)#按列名进行排序
df_obj.sort_index(by=[‘’,’’])#多列排序,使用时报该函数已过时,请用sort_values
df_obj.sort_values(by=[”,”])同上
一个numpy的例子
import numpy as np
data = {i: np.random.randn() for i in range(7)}
print (data)
print (dtype(data))
{0: -0.3545697629475486, 1: 1.3098551782757126, 2: -0.17715637837979628, 3: 0.7631836116626937, 4: 0.1599041446132432, 5: 0.7041281969761696, 6: 0.5984084616089319}
def printMax(x, y):
    '''Prints the maximum of two numbers.\
    The two values must be integers.'''
    x = int(x) # convert to integers, if possible
    y = int(y)

    if x > y:
        print (x, 'is maximum')
    else:
        print (y, 'is maximum')

printMax(3, 5)
print (printMax.__doc__)
print ('---------------')
print (help(printMax))
5 is maximum
Prints the maximum of two numbers. The two values must be integers.
/——————-
printMax(x, y)
Prints the maximum of two numbers. The two values must be integers.
None


 1639
1639


 被折叠的 条评论
为什么被折叠?


