# height is a vector
par(mfrow=c(2,2))
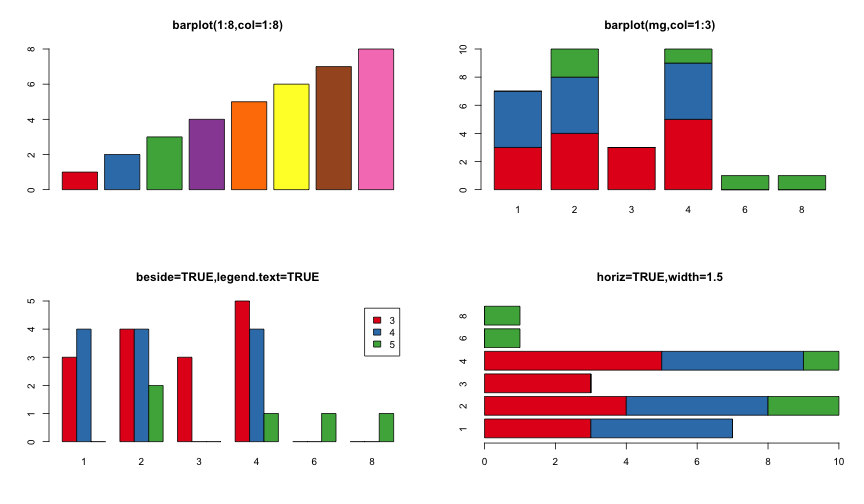
barplot(1:8,col=1:8,main="barplot(1:8,col=1:8)")
# height is a matrix
mg <- table(mtcars$gear,mtcars$carb)
barplot(mg,col=1:3,main="barplot(mg,col=1:3)")
# besides and legend
barplot(mg,col=1:3,beside=TRUE,legend.text=TRUE,main="beside=TRUE,legend.text=TRUE")
barplot(mg,col=1:3,horiz=TRUE,width=1.5,main="horiz=TRUE,width=1.5")
histogram
Description:

     The generic function ‘hist’ computes a histogram of the given data
     values.  If ‘plot = TRUE’, the resulting object of class
     ‘"histogram"’ is plotted by ‘plot.histogram’, before it is
     returned.

Usage:

     hist(x, ...)

     ## Default S3 method:
     hist(x, breaks = "Sturges",
          freq = NULL, probability = !freq,
          include.lowest = TRUE, right = TRUE,
          density = NULL, angle = 45, col = NULL, border = NULL,
          main = paste("Histogram of" , xname),
          xlim = range(breaks), ylim = NULL,
          xlab = xname, ylab,
          axes = TRUE, plot = TRUE, labels = FALSE,
          nclass = NULL, warn.unused = TRUE, ...)
par(mfrow=c(2,2))
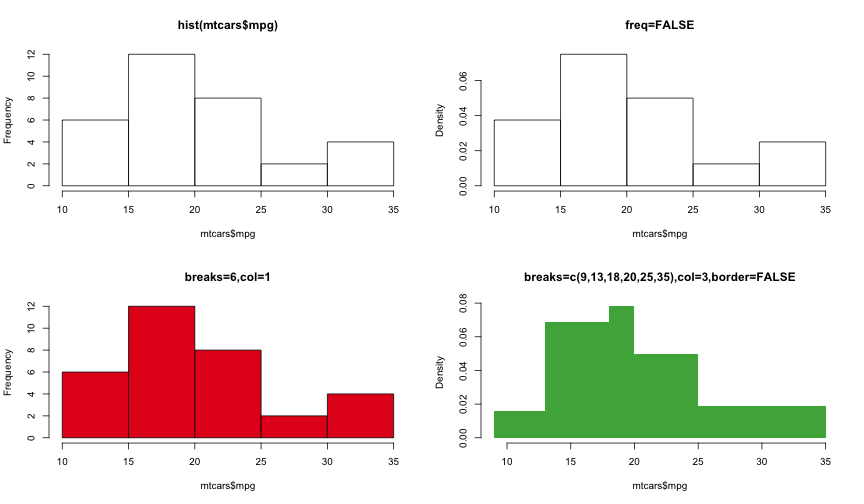
hist(mtcars$mpg,
main="hist(mtcars$mpg)")
# freqency or probability
hist(mtcars$mpg,freq=FALSE,
main="freq=FALSE")
# the breaks, colors and borders
hist(mtcars$mpg,breaks=6,col=1,
main="breaks=6,col=1")
hist(mtcars$mpg,breaks=c(9,13,18,20,25,35),col=3,border=FALSE,
main="breaks=c(9,13,18,20,25,35),col=3,border=FALSE")
pie
Description:
Draw a pie chart.
Usage:
pie(x, labels = names(x), edges = 200, radius = 0.8,
clockwise = FALSE, init.angle = if(clockwise) 90else0,
density = NULL, angle = 45, col = NULL, border = NULL,
lty = NULL, main = NULL, ...)
args(pie)
## function (x, labels = names(x), edges = 200, radius = 0.8, clockwise = FALSE,
## init.angle = if (clockwise) 90else0, density = NULL, angle = 45,
## col = NULL, border = NULL, lty = NULL, main = NULL, ...)
## NULL
par(mfrow=c(1,3))
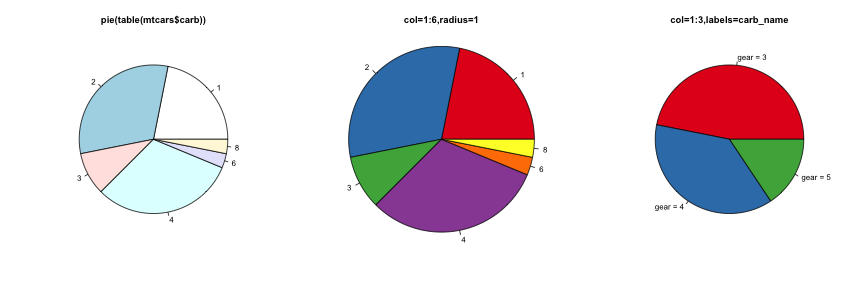
pie(table(mtcars$carb),
main="pie(table(mtcars$carb))")
# the radius and colors
pie(table(mtcars$carb),col=1:6,radius=1,
main="col=1:6,radius=1")
# the labels
carb_name <- paste("gear =",names(table(mtcars$gear)))
pie(table(mtcars$gear),col=1:3,labels=carb_name,
main="col=1:3,labels=carb_name")
boxplot
Description:

     Produce box-and-whisker plot(s) of the given (grouped) values.

Usage:

     boxplot(x, ...)

     ## S3 method for class 'formula'
     boxplot(formula, data = NULL, ..., subset, na.action = NULL)

     ## Default S3 method:
     boxplot(x, ..., range = 1.5, width = NULL, varwidth = FALSE,
             notch = FALSE, outline = TRUE, names, plot = TRUE,
             border = par("fg"), col = NULL, log = "",
             pars = list(boxwex = 0.8, staplewex = 0.5, outwex = 0.5),
             horizontal = FALSE, add = FALSE, at = NULL)
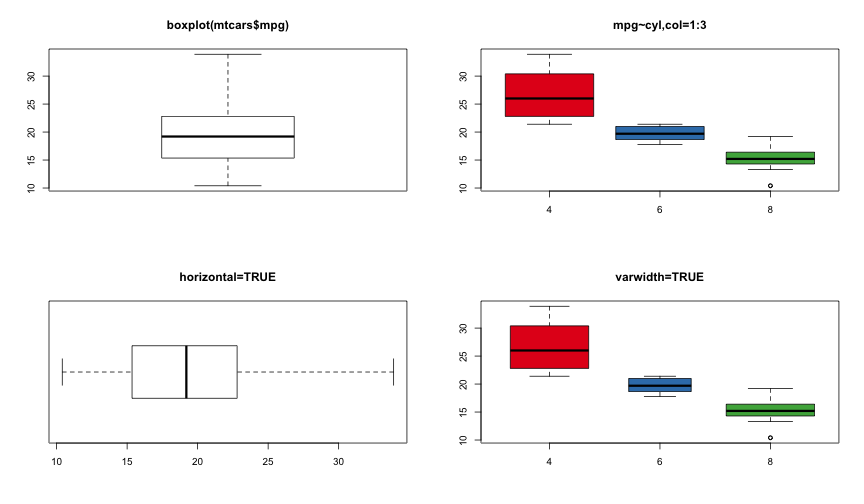
par(mfcol=c(2,2))
# single box
boxplot(mtcars$mpg,main="boxplot(mtcars$mpg)")
# horizontal box
boxplot(mtcars$mpg,horizontal=TRUE,main="horizontal=TRUE")
# multiple boxes generated from a formula
boxplot(mpg~cyl,mtcars,col=1:3,main="mpg~cyl,col=1:3")
# varwidth=TRUE
boxplot(mpg~cyl,mtcars,col=1:3,varwidth=TRUE,main="varwidth=TRUE")
R1 Lecture 07b Class NotesBy YU,XiangApr 14 2015常用统计图形直方图 条形图折线图 散点图饼图箱线图barplotDescription: Creates a bar plot with vertical or horizontal bars.Usage: barplot(height, ...) ## Default S3 me


 619
619

 被折叠的 条评论
为什么被折叠?
被折叠的 条评论
为什么被折叠?
 到【灌水乐园】发言


