


R1 Lecture 08 Class Notes
By YU, Xiang
Apr 21 2015
直线 线段 曲线 高级绘图函数 低级绘图函数
plot , curve , hist , barplot , pie , boxplot
points , lines , segments , abline , polygon
R内置的概率分布
一些概率分布函数名称,前缀 * = d,p,q,r
| === R function === | === Distribution Name === |
|---|---|
| *pois | Poisson Distribution |
| *binom | Binomial Distribution |
| *unif | Uniform Distribution |
| *norm | Normal Distribution |
| *chisq | Chi-squared Distribution |
| *exp | Exp Distribution |
| *t | Student T Distribution |
| *f | F Distribution |
| *beta | Beta Distribution |
| *cauchy | Cauchy Distribution |
# "d" for density distribution function
curve(dnorm,-5,5)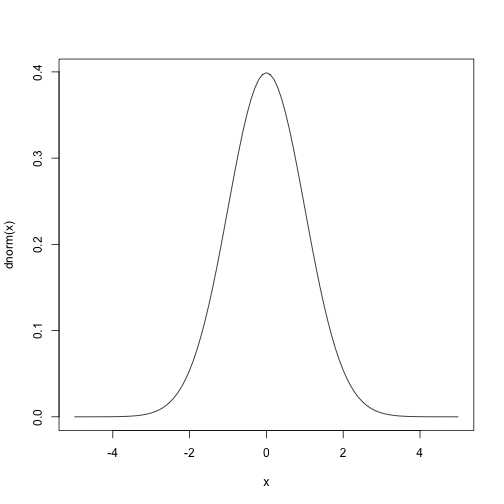
# "p" for cumulative distribution function
curve(pnorm,-5,5)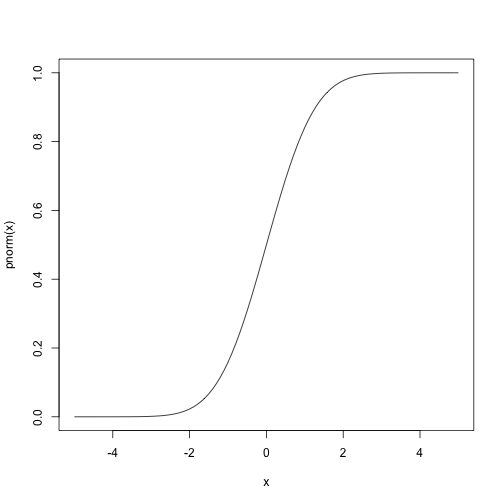
# "q" for quantile function
curve(qnorm,0,1)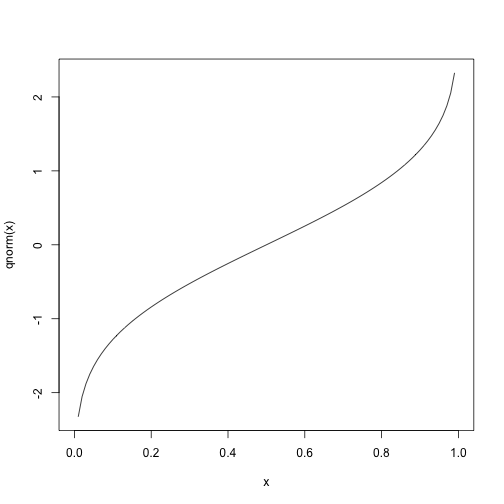
what is quantile function ?
qnorm(0.25) -> x2
x1 <- seq(-4,x2,length=50)
y1 <- dnorm(x1)
x <- c(-4,x1,x2,-4)
y <- c(0,y1,0,0)
curve(dnorm,-5,5,xlab="",ylab="dnorm")
abline(v=x2,col=2,lwd=2)
polygon(x,y,col=8)
text(3,0.2,"qnorm(0.25)",cex=2)
arrows(3,0.18,x2,-0.015,lwd=2,lty=5)
title(main="What is qnorm(0.25)",cex.main=2,
    sub="The aera of the pink region is 0.25",cex.sub=2)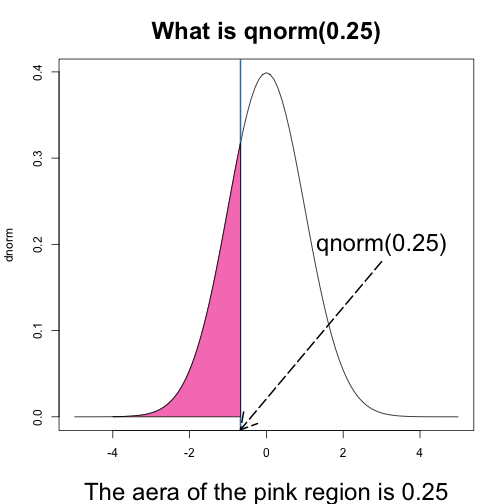
生成 pois,binom,t,f不同参数下对应的概率密度图,累积分布图
# pois的概率密度图和累积分布图,x=0:30, lambda=1,2,5,10
pois_dpplot <- function(x,lambda,ylim){
    for(i in lambda){
        y1 <- dpois(x,i)
        y2 <- ppois(x,i)
        plot(x,y1,type="h",ylim=ylim)
        title(main=paste("dpois with lambda =",i),cex.main=2)
        plot(x,y2,type="h",ylim=ylim)
        title(main=paste("ppois with lambda =",i),cex.main=2)
    }
}
par(mfcol=c(2,4))
pois_dpplot(0:30,c(1,2,5,10),ylim=c(0,0.5))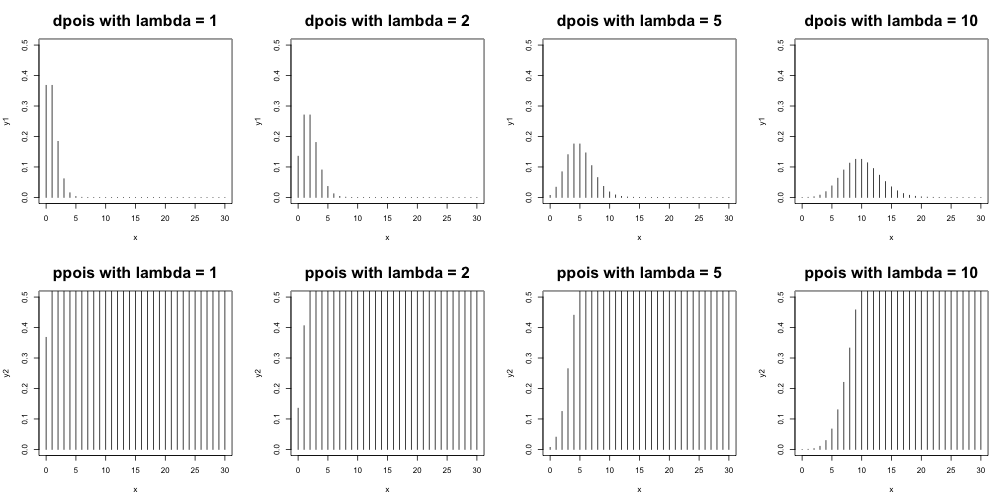
随机抽样
Random Samples and Permutations

Description:

     'sample' takes a sample of the specified size from the elements of
     'x' using either with or without replacement.

Usage:

     sample(x, size, replace = FALSE, prob = NULL)

     sample.int(n, size = n, replace = FALSE, prob = NULL)
# 从1~10中等概率随机抽取一个数
sample(1:10,1)## [1] 2sample(10,1)## [1] 2# 从1~10中等概率随机抽取5个数
sample(10,5)## [1] 2 3 9 5 8# 默认是不放回的抽样,如果需要可放回的抽样
sample(10,5,replace=TRUE)## [1] 6 1 4 5 10# 如果需要自定义不同数的概率值
sample(5,30,TRUE,prob=c(0.5,0.2,0.1,0.1,0.1))## [1] 4 1 3 1 1 1 3 3 4 1 1 1 4 1 1 1 1 3 1 2 1 2 3 1 2 1 3 1 5 1


 1192
1192

 被折叠的 条评论
为什么被折叠?
被折叠的 条评论
为什么被折叠?
 到【灌水乐园】发言


