


本文记录了使用Vue创建柱状图的代码。
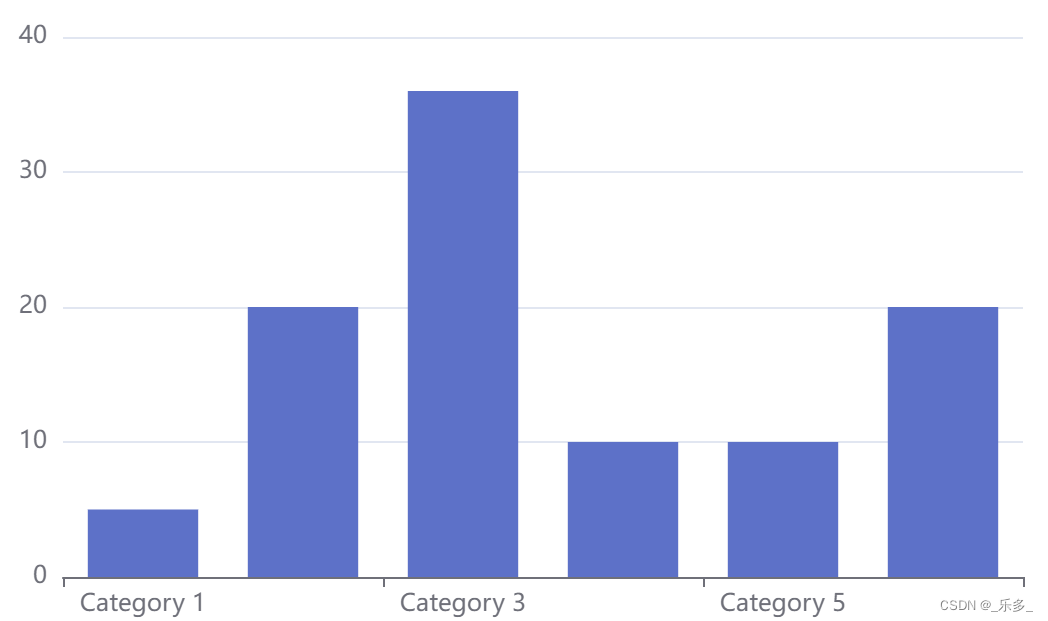
结果下图所示,
1. 创建 Vue 项目
npm create testVue
2. 安装 Echarts
npm install echarts --save
3. App.vue
将以下代码复制到App.vue
<template>
  <div id="app">
    <BarChartPage />
  </div>
</template>

<script>
import BarChartPage from './views/BarChartPage.vue';

export default {
  name: 'App',
  components: {
    BarChartPage,
  },
};
</script>

<style>
#app {
  font-family: Avenir, Helvetica, Arial, sans-serif;
  -webkit-font-smoothing: antialiased;
  -moz-osx-font-smoothing: grayscale;
  text-align: center;
  color: #2c3e50;
  margin-top: 60px;
}
</style>
4. BarChartPage.vue
在src下创建views文件夹,在views里面创建BarChartPage.vue,将以下代码复制到BarChartPage.vue中。
<template>
  <div id="a" style="width: 600px; height: 400px;"></div>
</template>

<script>
import * as echarts from 'echarts';

export default {
  name: 'BarChartPage',
  mounted() {
    const chC = this.$el;
    var myc = echarts.init(chC);

    myc.setOption({
      xAxis: {
        type: 'category',
        data: ['Category 1', 'Category 2', 'Category 3', 'Category 4', 'Category 5', 'Category 6'],
      },
      yAxis: {
        type: 'value',
      },
      series: [
        {
          type: 'bar',
          data: [5, 20, 36, 10, 10, 20],
        },
      ],
    });
  },
};
</script>
5. 运行项目
npm run serve


 878
878


 被折叠的 条评论
为什么被折叠?
被折叠的 条评论
为什么被折叠?
 到【灌水乐园】发言


