


数据
三维数组
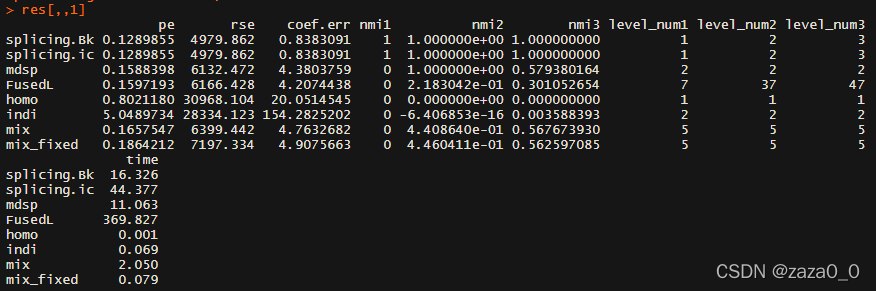
代码
具体代码需要根据数据进行一些修改。
library(ggplot2)
n_list = c(30, 60, 90)
method_list = c(1, 3, 7, 2, 4, 8, 5, 6)
metric_list = c(1, 3, 4:(4+2*p.x))
weight=5
m = 20
for(n in n_list)
{
  file_name = paste("results/p.x", p.x, "p.z",p.z, "n",n,"m",m, "sigma", sigma,"nrep",nrep, "weight", weight,"one",onelevel, sep="_")
  file_name = paste0(file_name, ".rda")
  load(file_name)
  res1 = res
  # file_name = paste("results/op.x", p.x, "p.z",p.z, "n",n,"m",m, "sigma", sigma,"nrep",nrep, "weight", weight,"one",onelevel, sep="_")
  # file_name = paste0(file_name, ".rda")
  # load(file_name)
  # res1[-c(2, 6),,] = res[-c(2, 6),,]
  file_name = paste("results/mp.x", p.x, "p.z",p.z, "n",n,"m",m, "sigma", sigma,"nrep",nrep, "weight", weight,"one",onelevel, sep="_")
  file_name = paste0(file_name, ".rda")
  load(file_name)
  res2 = res
  res = array(0, dim = c(8, 4+p.x*2, nrep), dimnames = list(c("splicing.Bk","splicing.ic",
                                                              "mdsp",
                                                              "FusedL","homo","indi","mix","mix_fixed"),
                                                            c("pe","rse","coef.err",paste0("nmi", 1:p.x), paste0("level_num",1:p.x),"time"),
                                                            NULL))

  res[c(1:7), , ] = res1
  res[8, , ] = res2[8,,]
  file_name = paste("results/p.x", p.x, "p.z",p.z, "n",n,"m",m, "sigma", sigma,"nrep",nrep, "weight", weight,"one",onelevel, sep="_")
  file_name = paste0(file_name, ".rda")
  save(res, file = file_name)
}
lineplot.process=function(n_list, method_list, metric_list)
{
  plot_meandat = NULL
  plot_sddat =NULL
  methods_nam = c("SGBESS","SGABESS",  "MDSP","Fused Lasso", "Homo", "Indi",  "Mixture", "Mixture(fixed)")
  metric_nam = c("RPE", "PEE", "NMI1" ,"NMI2", "NMI3", "SG Num1", "SG Num2", "SG Num3", "Run Time")
  for(n in n_list)
  {
    file_name = paste("results/p.x", p.x, "p.z",p.z, "n",n,"m",m, "sigma", sigma,"nrep",nrep, "weight", weight,"one",onelevel, sep="_")
    file_name = paste0(file_name, ".rda")
    load(file_name)
    res = res[method_list, metric_list, ]
    if(6 %in% method_list)
    {
      res[6, 7:9, ] = NA
    }
    mean_dat= apply(res, c(1, 2), mean)
    sd_dat = apply(res, c(1, 2), sd)
    rownames(mean_dat) = methods_nam[method_list]
    # tmp = cbind(n=n, mean=mean_dat, sd=sd_dat)
    plot_meandat = rbind(plot_meandat, cbind(n=n, mean_dat))
    plot_sddat =  rbind(plot_sddat, cbind(n=n, sd_dat))
  }
  method = rownames(plot_meandat)
  plot_meandat = as.data.frame(plot_meandat)
  plot_sddat = as.data.frame(plot_sddat)
  plot_meandat$method=method
  plot_sddat$method = method
  library(tidyr)
  plot_data = gather(plot_meandat, metric, value, -c(n,method))
  plot_sd = gather(plot_sddat, metric, sdvalue, -c(n,method))
  plot_dat = merge(plot_data, plot_sd, by=c("n", "method","metric"))
  colnames(plot_dat)[1]="N"
  plot_dat$metric = factor(plot_dat$metric , levels = dimnames(res)[[2]])
  plot_dat$method = factor(plot_dat$method, levels = methods_nam[method_list])
  plot_dat$N = factor(plot_dat$N)
  return(plot_dat)
}
lineplot <- function(n_list, method_list, metric_list)
{
  lineplot.dat = lineplot.process(n_list, method_list, metric_list)
  p1 <- ggplot(lineplot.dat, aes(n, value, group=method, color=method))+
    geom_line(size=0.8)+
    geom_point()+
    geom_errorbar(aes(ymin=value-sdvalue, ymax=value+sdvalue), width=.1,
                  position=position_dodge(0.05)) +
    facet_wrap(~metric, scales = "free") +
    theme(legend.position = "bottom")
  p1
}
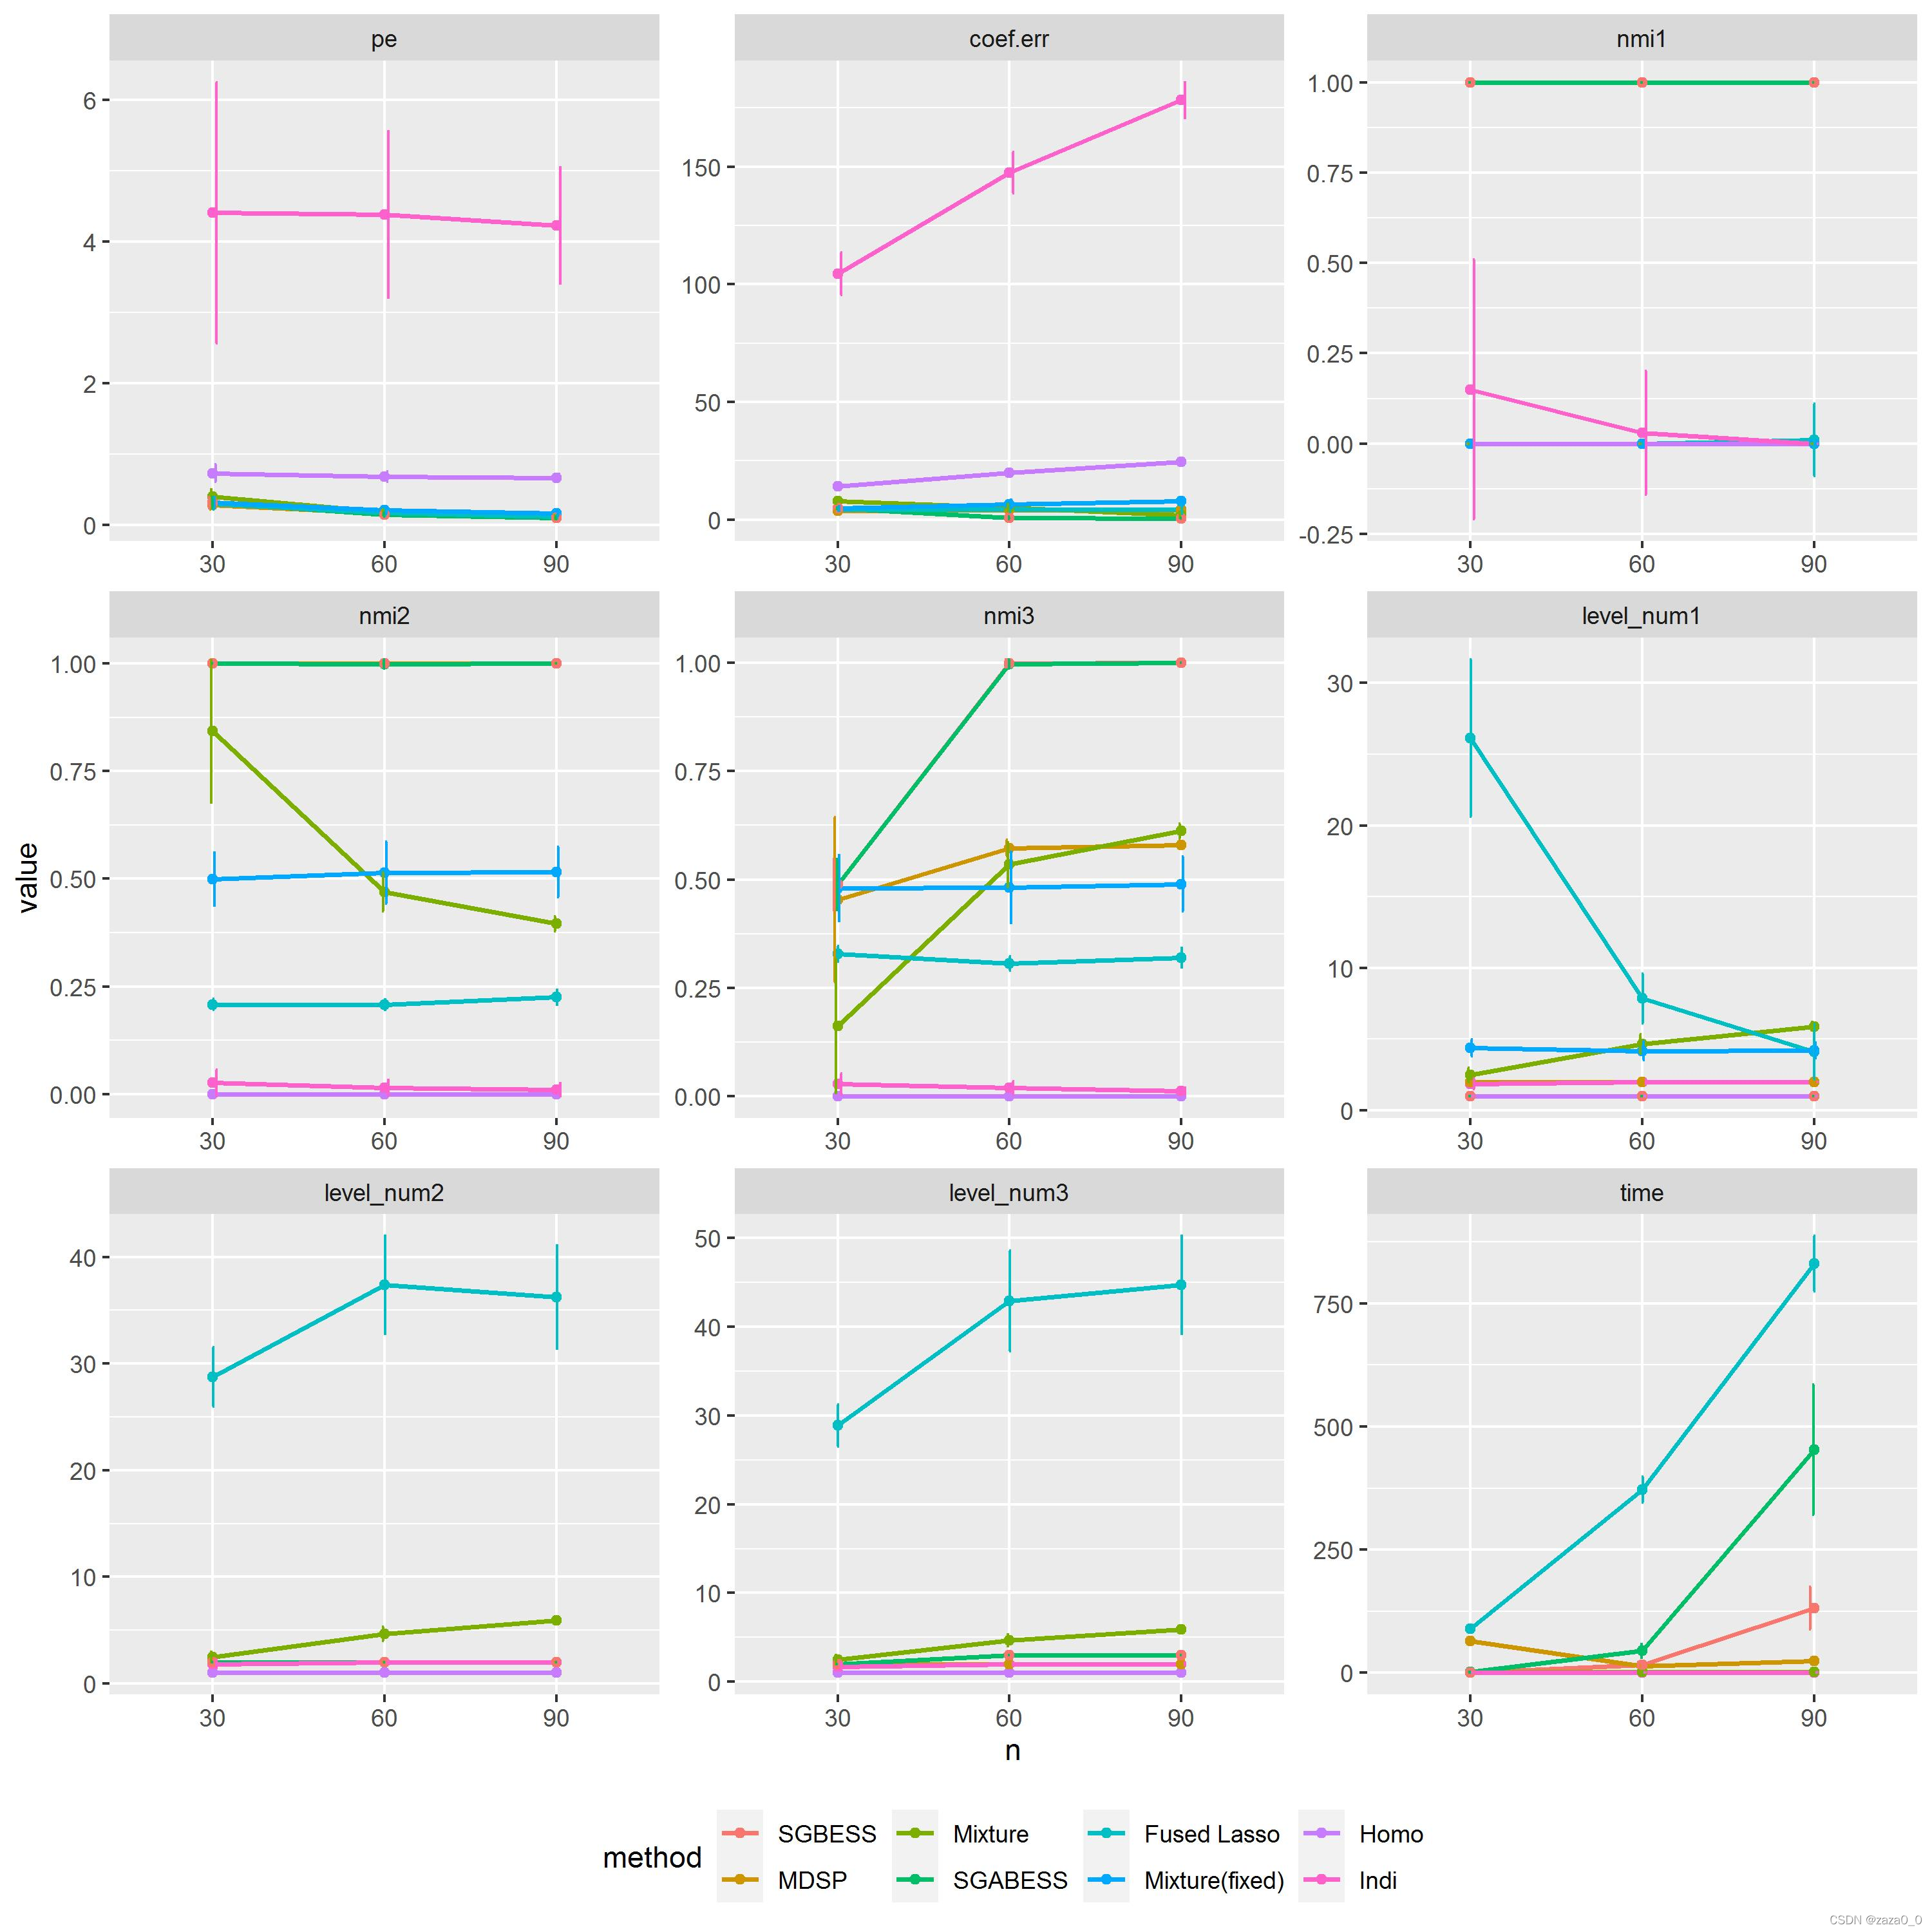
效果图


 841
841


 被折叠的 条评论
为什么被折叠?
被折叠的 条评论
为什么被折叠?
 到【灌水乐园】发言


