


Mean Shift 聚类算法
原文地址:http://blog.csdn.net/hjimce/article/details/45718593
作者:hjimce
一、mean shift 算法理论
Mean shift 算法是基于核密度估计的爬山算法,可用于聚类、图像分割、跟踪等,因为最近搞一个项目,涉及到这个算法的图像聚类实现,因此这里做下笔记。
(1)均值漂移的基本形式
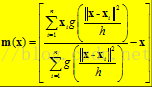
给定d维空间的n个数据点集X,那么对于空间中的任意点x的mean shift向量基本形式可以表示为:
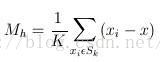
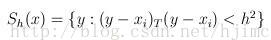
这个向量就是漂移向量,其中Sk表示的是数据集的点到x的距离小于球半径h的数据点。也就是:
而漂移的过程,说的简单一点,就是通过计算得漂移向量,然后把球圆心x的位置更新一下,更新公式为:

使得圆心的位置一直处于力的平衡位置。
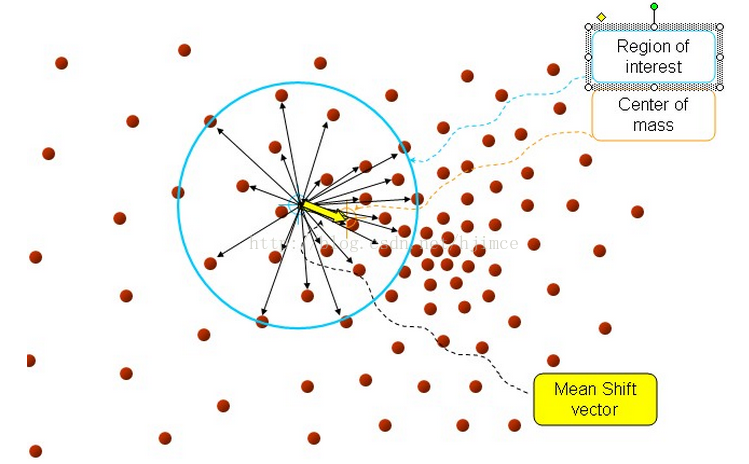
总结为一句话就是:求解一个向量,使得圆心一直往数据集密度最大的方向移动。说的再简单一点,就是每次迭代的时候,都是找到圆里面点的平均位置作为新的圆心位置。
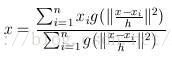
(2)加入核函数的漂移向量
这个说的简单一点就是加入一个高斯权重,最后的漂移向量计算公式为:
因此每次更新的圆心坐标为:
不过我觉得如果用高斯核函数,把这个算法称为均值漂移有点不合理,既然叫均值漂移,那么均值应该指的是权重相等,也就是(1)中的公式才能称之为真正的均值漂移。
我的简单理解mean shift算法是:物理学上力的合成与物体的运动。每次迭代通过求取力的合成向量,然后让圆心沿着力的合成方向,移动到新的平衡位置。
二、mean shift 聚类流程:
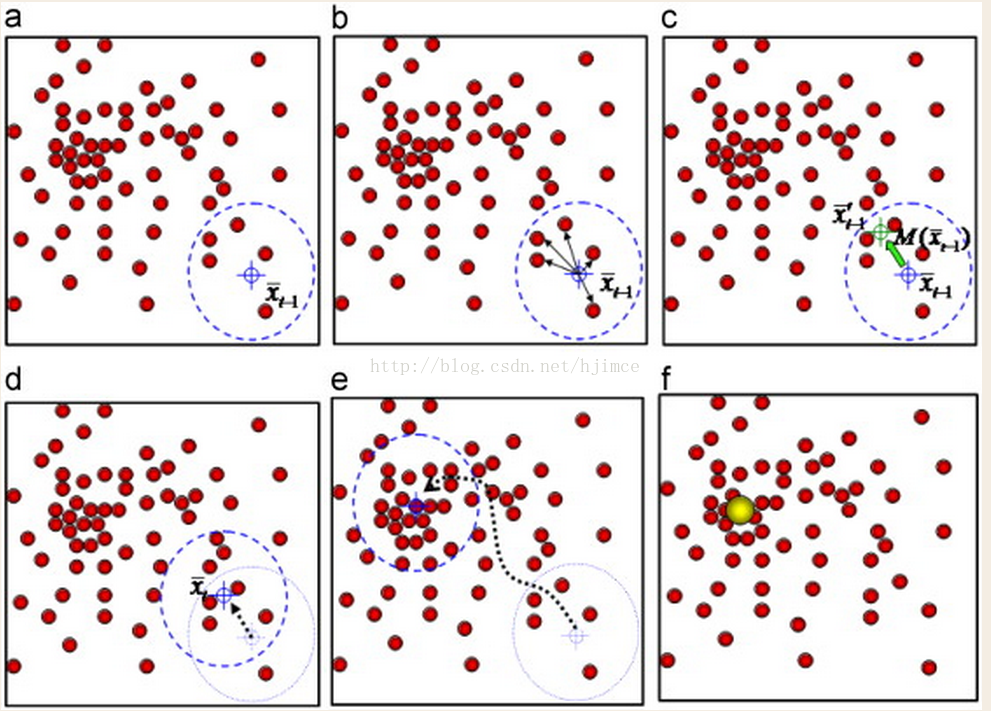
假设在一个多维空间中有很多数据点需要进行聚类,Mean Shift的过程如下:
1、在未被标记的数据点中随机选择一个点作为中心center;
2、找出离center距离在bandwidth之内的所有点,记做集合M,认为这些点属于簇c。同时,把这些求内点属于这个类的概率加1,这个参数将用于最后步骤的分类
3、以center为中心点,计算从center开始到集合M中每个元素的向量,将这些向量相加,得到向量shift。
4、center = center+shift。即center沿着shift的方向移动,移动距离是||shift||。
5、重复步骤2、3、4,直到shift的大小很小(就是迭代到收敛),记住此时的center。注意,这个迭代过程中遇到的点都应该归类到簇c。
6、如果收敛时当前簇c的center与其它已经存在的簇c2中心的距离小于阈值,那么把c2和c合并。否则,把c作为新的聚类,增加1类。
6、重复1、2、3、4、5直到所有的点都被标记访问。
7、分类:根据每个类,对每个点的访问频率,取访问频率最大的那个类,作为当前点集的所属类。
简单的说,mean shift就是沿着密度上升的方向寻找同属一个簇的数据点。
三、mean shift 聚类实现
Mean shift 算法不需要指定聚类个数,贴一下用matlab实现的聚类结果:
- clc
- close all;
- clear
- profile on
- %生成随机数据点集
- nPtsPerClust = 250;
- nClust = 3;
- totalNumPts = nPtsPerClust*nClust;
- m(:,1) = [1 1]';
- m(:,2) = [-1 -1]';
- m(:,3) = [1 -1]';
- var = .6;
- bandwidth = .75;
- clustMed = [];
- x = var*randn(2,nPtsPerClust*nClust);
- for i = 1:nClust
- x(:,1+(i-1)*nPtsPerClust:(i)*nPtsPerClust) = x(:,1+(i-1)*nPtsPerClust:(i)*nPtsPerClust) + repmat(m(:,i),1,nPtsPerClust);
- end
- data=x';
- % plot(data(:,1),data(:,2),'.')
- %mean shift 算法
- [m,n]=size(data);
- index=1:m;
- radius=0.75;
- stopthresh=1e-3*radius;
- visitflag=zeros(m,1);%标记是否被访问
- count=[];
- clustern=0;
- clustercenter=[];
- hold on;
- while length(index)>0
- cn=ceil((length(index)-1e-6)*rand);%随机选择一个未被标记的点,作为圆心,进行均值漂移迭代
- center=data(index(cn),:);
- this_class=zeros(m,1);%统计漂移过程中,每个点的访问频率
- %步骤2、3、4、5
- while 1
- %计算球半径内的点集
- dis=sum((repmat(center,m,1)-data).^2,2);
- radius2=radius*radius;
- innerS=find(dis<radius*radius);
- visitflag(innerS)=1;%在均值漂移过程中,记录已经被访问过得点
- this_class(innerS)=this_class(innerS)+1;
- %根据漂移公式,计算新的圆心位置
- newcenter=zeros(1,2);
- % newcenter= mean(data(innerS,:),1);
- sumweight=0;
- for i=1:length(innerS)
- w=exp(dis(innerS(i))/(radius*radius));
- sumweight=w+sumweight;
- newcenter=newcenter+w*data(innerS(i),:);
- end
- newcenter=newcenter./sumweight;
- if norm(newcenter-center) <stopthresh%计算漂移距离,如果漂移距离小于阈值,那么停止漂移
- break;
- end
- center=newcenter;
- plot(center(1),center(2),'*y');
- end
- %步骤6 判断是否需要合并,如果不需要则增加聚类个数1个
- mergewith=0;
- for i=1:clustern
- betw=norm(center-clustercenter(i,:));
- if betw<radius/2
- mergewith=i;
- break;
- end
- end
- if mergewith==0 %不需要合并
- clustern=clustern+1;
- clustercenter(clustern,:)=center;
- count(:,clustern)=this_class;
- else %合并
- clustercenter(mergewith,:)=0.5*(clustercenter(mergewith,:)+center);
- count(:,mergewith)=count(:,mergewith)+this_class;
- end
- %重新统计未被访问过的点
- index=find(visitflag==0);
- end%结束所有数据点访问
- %绘制分类结果
- for i=1:m
- [value index]=max(count(i,:));
- Idx(i)=index;
- end
- figure(2);
- hold on;
- for i=1:m
- if Idx(i)==1;
- plot(data(i,1),data(i,2),'.y');
- elseif Idx(i)==2;
- plot(data(i,1),data(i,2),'.b');
- elseif Idx(i)==3;
- plot(data(i,1),data(i,2),'.r');
- elseif Idx(i)==4;
- plot(data(i,1),data(i,2),'.k');
- elseif Idx(i)==5;
- plot(data(i,1),data(i,2),'.g');
- end
- end
- cVec = 'bgrcmykbgrcmykbgrcmykbgrcmyk';
- for k = 1:clustern
- plot(clustercenter(k,1),clustercenter(k,2),'o','MarkerEdgeColor','k','MarkerFaceColor',cVec(k), 'MarkerSize',10)
- end
%mean shift 算法
[m,n]=size(data);
index=1:m;
radius=0.75;
stopthresh=1e-3*radius;
visitflag=zeros(m,1);%标记是否被访问
count=[];
clustern=0;
clustercenter=[];
hold on;
while length(index)>0
cn=ceil((length(index)-1e-6)*rand);%随机选择一个未被标记的点,作为圆心,进行均值漂移迭代
center=data(index(cn)?;
this_class=zeros(m,1);%统计漂移过程中,每个点的访问频率
%步骤2、3、4、5
while 1
    %计算球半径内的点集
    dis=sum((repmat(center,m,1)-data).^2,2);
    radius2=radius*radius;
    innerS=find(dis<radius*radius);
    visitflag(innerS)=1;%在均值漂移过程中,记录已经被访问过得点
    this_class(innerS)=this_class(innerS)+1;
    %根据漂移公式,计算新的圆心位置
    newcenter=zeros(1,2);
   % newcenter= mean(data(innerS,:),1);
    sumweight=0;
    for i=1:length(innerS)
        w=exp(dis(innerS(i))/(radius*radius));
        sumweight=w+sumweight;
        newcenter=newcenter+w*data(innerS(i),:);
    end
    newcenter=newcenter./sumweight;

    if norm(newcenter-center) <stopthresh%计算漂移距离,如果漂移距离小于阈值,那么停止漂移
        break;
    end
    center=newcenter;
    plot(center(1),center(2),'*y');
end
%步骤6 判断是否需要合并,如果不需要则增加聚类个数1个
mergewith=0;
for i=1:clustern
    betw=norm(center-clustercenter(i,:));
    if betw<radius/2
        mergewith=i;
        break;
    end
end
if mergewith==0           %不需要合并
    clustern=clustern+1;
    clustercenter(clustern,:)=center;
    count(:,clustern)=this_class;
else                      %合并
    clustercenter(mergewith,:)=0.5*(clustercenter(mergewith,:)+center);
    count(:,mergewith)=count(:,mergewith)+this_class;
end
%重新统计未被访问过的点
index=find(visitflag==0);
end%结束所有数据点访问
%绘制分类结果
for i=1:m
[value index]=max(count(i,:));
Idx(i)=index;
end
figure(2);
hold on;
for i=1:m
if Idx(i)==1;
plot(data(i,1),data(i,2),’.y’);
elseif Idx(i)==2;
plot(data(i,1),data(i,2),’.b’);
elseif Idx(i)==3;
plot(data(i,1),data(i,2),’.r’);
elseif Idx(i)==4;
plot(data(i,1),data(i,2),’.k’);
elseif Idx(i)==5;
plot(data(i,1),data(i,2),’.g’);
end
end
cVec = ‘bgrcmykbgrcmykbgrcmykbgrcmyk’;
for k = 1:clustern
plot(clustercenter(k,1),clustercenter(k,2),‘o’,‘MarkerEdgeColor’,‘k’,‘MarkerFaceColor’,cVec(k), ‘MarkerSize’,10)
end
在图像分割、图像跟踪,需要加入核函数。
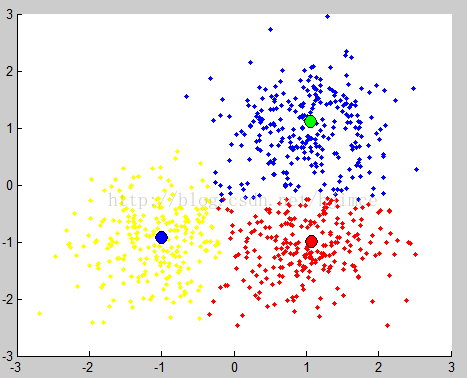
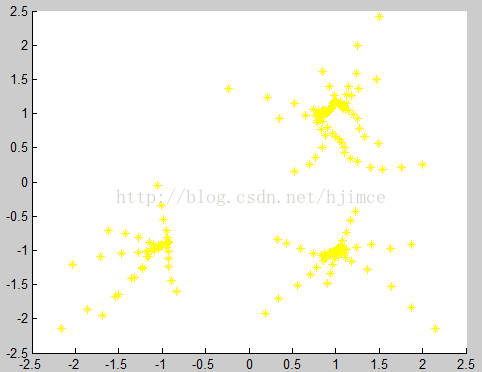
聚类结果 圆心漂移轨迹
*********作者:hjimce 联系qq:1393852684 更多资源请关注我的博客:http://blog.csdn.net/hjimce 原创文章,转载请保留本行信息。*****************


 9万+
9万+


 被折叠的 条评论
为什么被折叠?
被折叠的 条评论
为什么被折叠?
 到【灌水乐园】发言


