


import numpy as np
import matplotlib.pyplot as plt
from sklearn.metrics import roc_curve
y = np.array([1,1,2,2])
pred = np.array([0.1, 0.4, 0.35, 0.8])
fpr, tpr, thresholds = roc_curve(y, pred, pos_label=2)
print('fpr: ' + str(fpr))
print('tpr: ' + str(tpr))
print('thresholds: ' + str(thresholds))
from sklearn.metrics import auc
AUC = auc(fpr, tpr)
print('AUC: ' + str(AUC))
print('\n\n####################################################')
help(roc_curve)
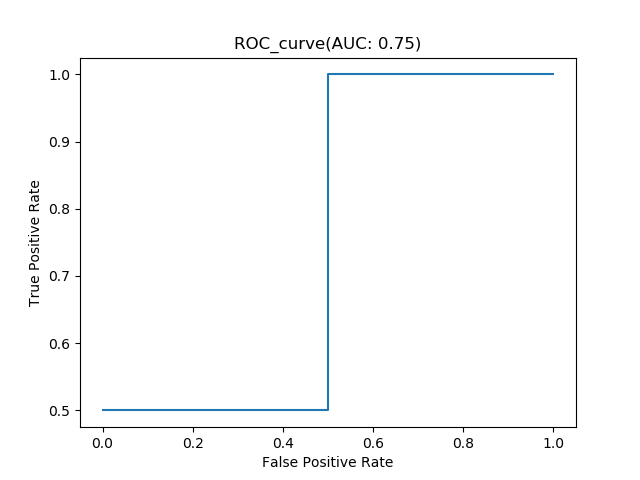
plt.plot(fpr, tpr)
plt.title('ROC_curve' + '(AUC: ' + str(AUC) + ')' )
plt.ylabel('True Positive Rate')
plt.xlabel('False Positive Rate')
plt.show()
运行结果:
fpr: [ 0.   0.5  0.5  1. ]
tpr: [ 0.5  0.5  1.   1. ]
thresholds: [ 0.8   0.4   0.35  0.1 ]
AUC: 0.75


####################################################
Help on function roc_curve in module sklearn.metrics.ranking:

roc_curve(y_true, y_score, pos_label=None, sample_weight=None, drop_intermediate=True)
    Compute Receiver operating characteristic (ROC)

    Note: this implementation is restricted to the binary classification task.

    Read more in the :ref:`User Guide <roc_metrics>`.

    Parameters
    ----------

    y_true : array, shape = [n_samples]
        True binary labels in range {0, 1} or {-1, 1}.  If labels are not
        binary, pos_label should be explicitly given.

    y_score : array, shape = [n_samples]
        Target scores, can either be probability estimates of the positive
        class, confidence values, or non-thresholded measure of decisions
        (as returned by "decision_function" on some classifiers).

    pos_label : int or str, default=None
        Label considered as positive and others are considered negative.

    sample_weight : array-like of shape = [n_samples], optional
        Sample weights.

    drop_intermediate : boolean, optional (default=True)
        Whether to drop some suboptimal thresholds which would not appear
        on a plotted ROC curve. This is useful in order to create lighter
        ROC curves.

        .. versionadded:: 0.17
           parameter *drop_intermediate*.

    Returns
    -------
    fpr : array, shape = [>2]
        Increasing false positive rates such that element i is the false
        positive rate of predictions with score >= thresholds[i].

    tpr : array, shape = [>2]
        Increasing true positive rates such that element i is the true
        positive rate of predictions with score >= thresholds[i].

    thresholds : array, shape = [n_thresholds]
        Decreasing thresholds on the decision function used to compute
        fpr and tpr. `thresholds[0]` represents no instances being predicted
        and is arbitrarily set to `max(y_score) + 1`.

    See also
    --------
    roc_auc_score : Compute the area under the ROC curve

    Notes
    -----
    Since the thresholds are sorted from low to high values, they
    are reversed upon returning them to ensure they correspond to both ``fpr``
    and ``tpr``, which are sorted in reversed order during their calculation.

    References
    ----------
    .. [1] `Wikipedia entry for the Receiver operating characteristic
            <https://en.wikipedia.org/wiki/Receiver_operating_characteristic>`_


    Examples
    --------
    >>> import numpy as np
    >>> from sklearn import metrics
    >>> y = np.array([1, 1, 2, 2])
    >>> scores = np.array([0.1, 0.4, 0.35, 0.8])
    >>> fpr, tpr, thresholds = metrics.roc_curve(y, scores, pos_label=2)
    >>> fpr
    array([ 0. ,  0.5,  0.5,  1. ])
    >>> tpr
    array([ 0.5,  0.5,  1. ,  1. ])
    >>> thresholds
    array([ 0.8 ,  0.4 ,  0.35,  0.1 ])


 1487
1487

 被折叠的 条评论
为什么被折叠?
被折叠的 条评论
为什么被折叠?
 到【灌水乐园】发言


