


Matlab在绘图的过程中,为了充分地说明数据,往往需要配置文字说明,如公式等。此时,就需要LaTeX来帮助图例中的文字格式更加美观了。
Matlab 图形中title 、xlabel、ylabel 、zlabel、textbox 和legend 等的Interpreter 属性有三个属性: latex 、tex、
none。默认为tex 。
LaTeX语法格式如下:
| Tex字符 | 含义 |
| \alpha | α |
| \beta | β |
| \gamma | γ |
| \delta | δ |
| \epsilon | ϵ |
| \zeta | ζ |
| \eta | η |
| \theta | θ |
| \Lambda | Λ |
| \xi | ξ |
| \pi | π |
| \rho | ρ |
| \sigma | σ |
| \int | ∫ |
| \phi | ϕ |
| \leq | ≤ |
| \Delta | Δ |
| \Theta | Θ |
| \psi | ψ |
| \Pi | Π |
| \infty | ∞ |
| ^ | 上标 |
| _ | 下标 |
| \sum_{i=1}^{n} x_{i} | $$\sum_{i=1}^{n} x_{i}$$ |
| \int_{0}^{1} | $$ \int_{0}^{1}$$ |
| \lim_{n \rightarrow \infty} | $$\lim_{n \rightarrow \infty}$$ |
| \frac{1}x | $$\frac{1}x$$ |
| \sqrt{x} | $$\sqrt{x}$$ |
| \overline{x} | $$\overline{x}$$ |
| \underline{x} | $$\underline{x}$$ |
| \bf | 粗体 |
| \it | 斜体 |
| \fontsize{字体大小} | 字体大小 |
| \color{颜色名}颜色名:颜色名有12种,分别为red、green、yellow、magenta、blue、black、white、 cyan、gray、barkGreen、orange和lightBlue。例如:\color{magenta}magenta。 | 字体颜色 |
| \color[rgb]{a b c}:设置字体颜色为RGB矩阵[a b c]所表示的颜色。 a、b和c都在[0 1] 范围内。例如:color[rgb]{0 .5 .5}。 | 字体颜色 |
| \frac{分子}{分母} | $$\frac{分子}{分母}$$ |
为了使用LaTeX格式展示文字,需要设置对应的Interpreter选项,如对于xtick标签来说,需要设置TickLabelInterpreter属性为latex,具体的设置过程如下所示。
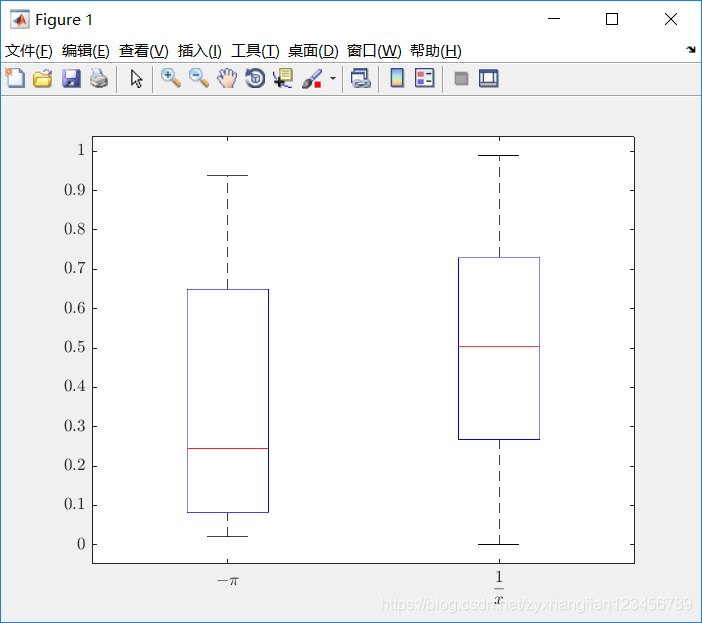
下面是具体代码,注意,需要先调用boxplot绘图,再设置解析器为latex,同时latex要使用$$包围。
test1=rand(1,20);                   %20长度
test2=rand(1,100);                  %100 长度
combineData = [test1,test2];        % 组合
group = [zeros(1,20),ones(1,100)];
boxplot(combineData,group);
set(gca,'TickLabelInterpreter','latex');
set(gca,'xticklabel',{'$$-\pi$$','$$\frac{1}x$$'});
关于latex,笔者推荐两个工具:
- Mathpix:一个好用的软件,可以截图产生latex公式的代码,非常非常方便;
- LatexOnline:http://latex.91maths.com/,当您需要调试您的latex代码时,可以在这个在线网站上调试。


 2172
2172

 被折叠的 条评论
为什么被折叠?
被折叠的 条评论
为什么被折叠?
 到【灌水乐园】发言


