


本文转载自:http://seekingalpha.com/article/868521-risk-parity-a-bullet-proof-investment-strategy?page=2#
The basic idea behind risk parity is to diversify a portfolio in terms of risk, but not in terms of dollar values. In other words, risk is spread equally between asset classes so that each asset class contributes the same amount of volatility to the portfolio rather than an equal amount of capital. A traditional balanced portfolio, where 60 percent is allocated in equities and the remaining 40 percent is invested in bonds, may look balanced from a capital allocation point of view, instead of from a risk perspective.
In our article, we would like to compare a traditional 60/40 portfolio with a risk parity approach, which uses the same underlying asset classes. In our comparison, we will use the SPDR S&P 500 ETF (NYSEARCA:SPY) to represent the allocation to equities and the iShares Barclays 20+ Year Treasury Bond (NYSEARCA:TLT) as well as the iShares iBoxx $ Invest Grade Corp Bond (NYSEARCA:LQD) to represent the fixed income investments. In our example, there is no allowance for transaction costs or brokerage fees.
By applying a risk parity approach, it is absolute necessary to determine the weightings of each asset class on a regular basis, since the correlation among asset classes is not stable over time. For that reason, we are using a rolling covariance matrix to determine the appropriate weights for each asset class to ensure that each asset class contributes the same amount of risk.
Moreover, we have calculated the risk contribution of each asset class for a traditional balanced portfolio, where 60 percent is invested in the SPDR S&P 500 ETF , 20 percent being put into the iShares Barclays 20+ Year Treasury Bond and the remaining 20 percent are allocated to the iShares iBoxx $ Invest Grade Corp Bond .
By adding up each contribution to risk, we will receive the overall portfolio volatility at a specific point of time. The volatility of the balanced portfolio is mainly driven by the 60 percent investment in equities while bonds just contribute very little risk (Chart 1). Especially in times of market turbulence, like in 2008, the diversification benefits are reduced significantly as equities are the main risk contributor within the portfolio. If an asset class is negative correlated to the remaining ones at a specific point of time, then its contribution to risk turns negative (for example TLT during 2011). Therefore, investors could easily put more weight to that specific asset class, without having to increase the total portfolio volatility. This effect can be also seen as the diversification potential of that specific asset class. That is exactly where the risk parity portfolio comes into play.

Chart 1: Volatility and CTR - Balanced Portfolio
As each asset class contributes the same amount of risk, its diversification potential is much better utilized compared with a traditional balanced portfolio. If we have a closer look at the risk parity portfolio (Chart 2), we can see that each asset class contributes the same amount of risk at any given time, although the portfolio volatility changes over time. For that reason, the average volatility of the risk parity portfolio is much lower compared with the traditional investment strategy. Many institutional investors (e.g. Bridgewater) are using leverage to keep the portfolio volatility at a certain target level and to increase the overall portfolio performance).
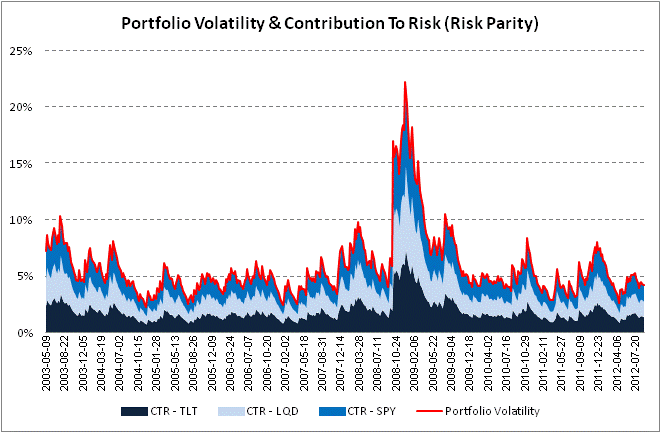
Chart 2: Volatility and CTR - Risk Parity Portfolio
If we have a look at the specific weightings within the risk parity portfolio, we can see that on average, 30 percent is invested in the SPDR S&P 500 ETF , 41 percent is invested in the iShares iBoxx $ Invest Grade Corp Bond and the remaining 29 percent are allocated to the iShares Barclays 20+ Year Treasury Bond (Chart 3).

Chart 3: Historical Allocation - Risk Parity
Since we have only focused on the contribution to risk so far, we would like to examine how these two portfolios have been performing the past. Table 1 presents the results of our back tests from Sept. 5, 2003 until Sept. 7, 2012 on the two portfolios described previously (including one day slippage). The first column tests the risk parity approach while the second on represents a traditional balanced portfolio.

Table 1: Performance and Risk Ratios
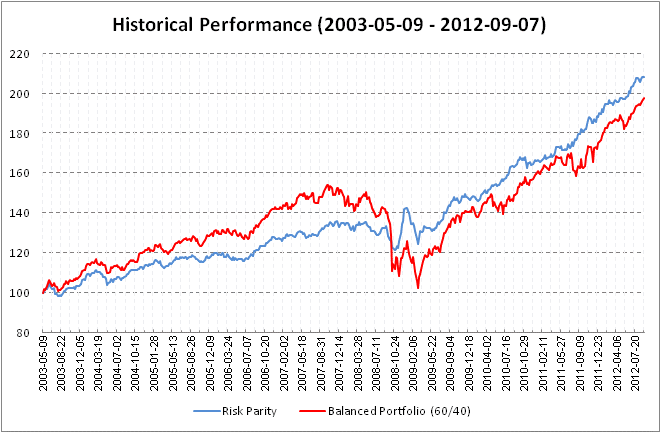
The risk parity has an annualized return of 8.16% while a buy and hold has only generated an annualized rate of return of 7.55%. More importantly, on a risk-adjusted basis (Sharpe Ratio), the equal risk portfolio is strongly outperforming the traditional weighting. Nevertheless, the risk parity portfolio is underperforming the traditional one, when the stock market is in a strong bull market without any major market turns (like in 2003 until 2007).
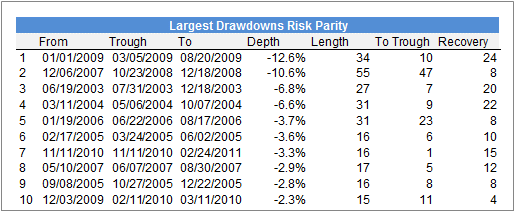
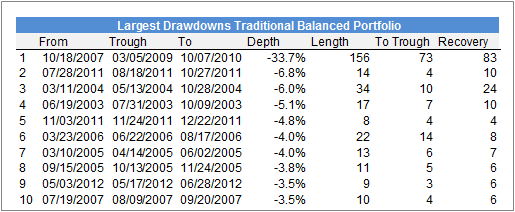
If we have a closer look on the diversification benefits (reducing risk during turbulent market conditions), we can see that the risk parity has also shown significant lower draw-downs in the past. The maximum draw down for the risk parity portfolio was only 12.6 percent, compared with 33.7 percent for the balanced approach. That makes roughly 2 times more. In total, the risk parity portfolio was reaching a new high after 34 weeks compared with 156 weeks for the balanced portfolio.
The bottom line: risk parity is a good alternative approach if investors are searching for a highly diversified portfolio. Since it can fully utilize the benefits of diversification, so then the portfolio is able to reduce draw-downs considerably, especially in times of market turbulence. Nevertheless, the outcome of the strategy depends mainly by chosen asset classes, as this investment strategy allocates the most to those ETFs which have the lowest volatility. Therefore please bear in mind, that any approach is only as good as the expected future value of its underlying asset classes as well as their diversification characteristics.
Disclosure: I have no positions in any stocks mentioned, and no plans to initiate any positions within the next 72 hours. I wrote this article myself, and it expresses my own opinions. I am not receiving compensation for it. I have no business relationship with any company whose stock is mentioned in this article.


 2万+
2万+

 被折叠的 条评论
为什么被折叠?
被折叠的 条评论
为什么被折叠?
 到【灌水乐园】发言


