nvidia-smi是用来查看GPU使用情况的。我常用这个命令判断哪几块GPU空闲,但是最近的GPU使用状态让我很困惑,于是把nvidia-smi命令显示的GPU使用表中各个内容的具体含义解释一下。
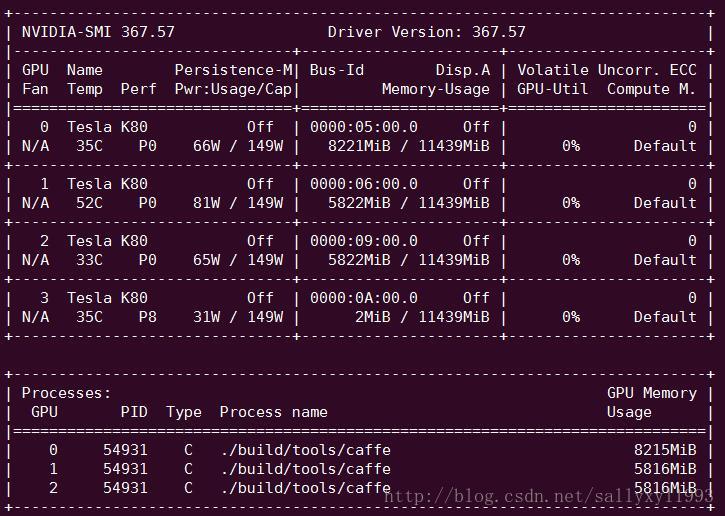
这是服务器上特斯拉K80的信息。
显存占用和GPU占用是两个不一样的东西 ,显卡是由GPU和显存等组成的,显存和GPU的关系有点类似于内存和CPU的关系。我跑caffe代码的时候显存占得少,GPU占得多,师弟跑TensorFlow代码的时候,显存占得多,GPU占得少。
背景
qgzang@ustc :~ $ nvidia-smi -h
输出如下信息:
NVIDIA System Management Interface – v352.79
NVSMI provides monitoring information for Tesla and select Quadro devices.
Note that the functionality of NVSMI is exposed through the NVML C-based Python wrappers to NVML are also available. The output of NVSMI is
http://developer.nvidia.com/nvidia-management-library-nvml/ http://pypi.python.org/pypi/nvidia-ml-py/
Supported products:
Full Support All Tesla products, starting with the Fermi architecture All Quadro products, starting with the Fermi architecture All GRID products, starting with the Kepler architecture GeForce Titan products, starting with the Kepler architecture Limited Support All Geforce products, starting with the Fermi architecture
nvidia-smi [OPTION1 [ARG1]] [OPTION2 [ARG2]] ...
参数 详解 -h, –help Print usage information and exit.
参数 详解 -L, –list-gpus Display a list of GPUs connected to the system.
qgzang@ustc:~$ nvidia-smi -L
GPU 0 : GeForce GTX TITAN X (UUID: GPU-xxxxx -xxx -xxxxx -xxx -xxxxxx )
参数 详解 -i,–id= Target a specific GPU. -f,–filename= Log to a specified file, rather than to stdout. -l,–loop= Probe until Ctrl+C at specified second interval.
参数 详解 -q, –query -u,–unit Show unit, rather than GPU, attributes. -i,–id= Target a specific GPU or Unit. -f,–filename= Log to a specified file, rather than to stdout. -x,–xml-format Produce XML output. –dtd When showing xml output, embed DTD. -d,–display= Display only selected information: MEMORY, -l, –loop= Probe until Ctrl+C at specified second interval. -lms, –loop-ms= Probe until Ctrl+C at specified millisecond interval.
参数 详解 补充 –query-gpu= Information about GPU. Call –help-query-gpu for more info. –query-supported-clocks= List of supported clocks. Call –help-query-supported-clocks for more info. –query-compute-apps= List of currently active compute processes. Call –help-query-compute-apps for more info. –query-accounted-apps= List of accounted compute processes. Call –help-query-accounted-apps for more info. –query-retired-pages= List of device memory pages that have been retired. Call –help-query-retired-pages for more info.
参数 命令 -i, –id= Target a specific GPU or Unit. -f, –filename= Log to a specified file, rather than to stdout. -l, –loop= Probe until Ctrl+C at specified second interval. -lms, –loop-ms= Probe until Ctrl+C at specified millisecond interval.
参数 命令 补充 -pm, –persistence-mode= Set persistence mode: 0/DISABLED, 1/ENABLED -e, –ecc-config= Toggle ECC support: 0/DISABLED, 1/ENABLED -p, –reset-ecc-errors= Reset ECC error counts: 0/VOLATILE, 1/AGGREGATE -c, –compute-mode= Set MODE for compute applications: 0/DEFAULT,1/EXCLUSIVE_THREAD (deprecated),2/PROHIBITED, 3/EXCLUSIVE_PROCESS –gom= Set GPU Operation Mode: 0/ALL_ON, 1/COMPUTE, 2/LOW_DP -r –gpu-reset Trigger reset of the GPU.
参数 命令 -t, –toggle-led= Set Unit LED state: 0/GREEN, 1/AMBER -i, –id= Target a specific Unit.
参数 命令 –dtd Print device DTD and exit. -f, –filename= Log to a specified file, rather than to stdout. -u, –unit Show unit, rather than device, DTD. –debug= Log encrypted debug information to a specified file.
参数 命令 补充 pmon Displays process stats in scrolling format. “nvidia-smi pmon -h” for more information.
参数 命令 补充 topo Displays device/system topology. “nvidia-smi topo -h” for more information. Please see the nvidia-smi(1) manual page for more detailed information.


 2万+
2万+

 被折叠的 条评论
为什么被折叠?
被折叠的 条评论
为什么被折叠?
 到【灌水乐园】发言


