


from sklearn.metrics import classification_report
# y_pred是预测标签
y_pred, y_true =[1,0,1,0], [0,0,1,0]
print(classification_report(y_true=y_true, y_pred=y_pred))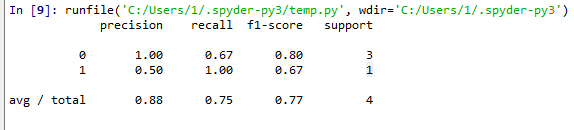
混淆矩阵
from sklearn.metrics import confusion_matrix
# y_pred是预测标签
y_pred, y_true =[1,0,1,0], [0,0,1,0]
c=confusion_matrix(y_true=y_true, y_pred=y_pred)
print(c)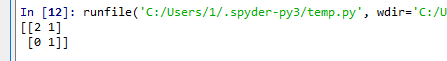
绘制ROC曲线。
import matplotlib.pyplot as plt
from sklearn.metrics import roc_curve, auc
# y_test:实际的标签, y_pred:预测的概率值。
y_pred, y_test =[1,1,1,0], [0,0,1,0]
fpr, tpr, thresholds = roc_curve(y_test, y_pred)
roc_auc = auc(fpr, tpr)
#画图,只需要plt.plot(fpr,tpr),变量roc_auc只是记录auc的值,通过auc()函数能计算出来
plt.plot(fpr, tpr, lw=1, label='ROC(area = %0.2f)' % (roc_auc))
plt.xlabel("FPR (False Positive Rate)")
plt.ylabel("TPR (True Positive Rate)")
plt.title("Receiver Operating Characteristic, ROC(AUC = %0.2f)"% (roc_auc))
plt.show()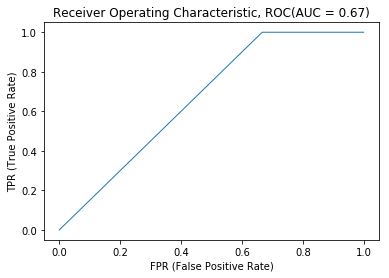
算分auc
from sklearn.metrics import roc_auc_score
# y_test:实际的标签, dataset_pred:预测的概率值。
y_test, dataset_pred =[1,0,1,0], [0,0,1,0]
rs=roc_auc_score(y_test, dataset_pred)
print(rs)#0.75


 3957
3957

 被折叠的 条评论
为什么被折叠?
被折叠的 条评论
为什么被折叠?
 到【灌水乐园】发言


