


💥💥💞💞欢迎来到本博客❤️❤️💥💥
🏆博主优势:🌞🌞🌞博客内容尽量做到思维缜密,逻辑清晰,为了方便读者。
⛳️座右铭:行百里者,半于九十。
📋📋📋本文目录如下:🎁🎁🎁
目录
⛳️赠与读者
👨💻做科研,涉及到一个深在的思想系统,需要科研者逻辑缜密,踏实认真,但是不能只是努力,很多时候借力比努力更重要,然后还要有仰望星空的创新点和启发点。当哲学课上老师问你什么是科学,什么是电的时候,不要觉得这些问题搞笑。哲学是科学之母,哲学就是追究终极问题,寻找那些不言自明只有小孩子会问的但是你却回答不出来的问题。建议读者按目录次序逐一浏览,免得骤然跌入幽暗的迷宫找不到来时的路,它不足为你揭示全部问题的答案,但若能让人胸中升起一朵朵疑云,也未尝不会酿成晚霞斑斓的别一番景致,万一它居然给你带来了一场精神世界的苦雨,那就借机洗刷一下原来存放在那儿的“躺平”上的尘埃吧。
或许,雨过云收,神驰的天地更清朗.......🔎🔎🔎
💥1 概述
文献来源:

摘要
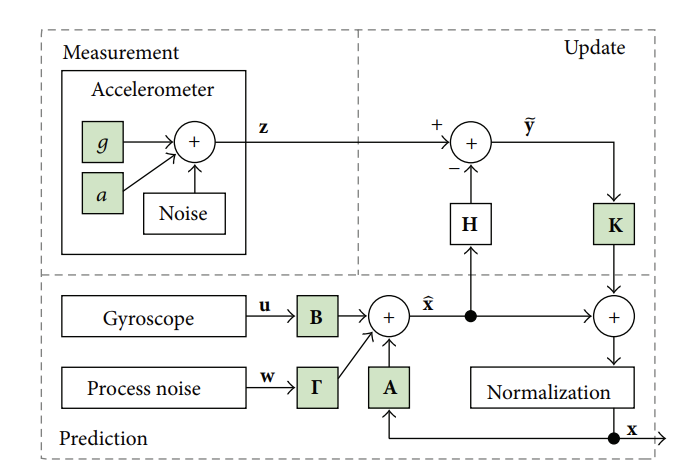
本文提出了一种使用自适应扩展卡尔曼滤波器的姿态估计算法,用于低成本微机电系统(MEMS)三轴加速度计和陀螺仪,即惯性测量单元(IMUs)。尽管这些MEMS传感器相对便宜,但它们提供的测量比传统高质量陀螺仪和加速度计更不准确。为了能够在所有情况下精确地使用这些低成本的MEMS传感器,提出了一种新颖的姿态估计算法,用于融合三轴陀螺仪和加速度计测量。采用扩展卡尔曼滤波器来估计方向余弦矩阵(DCM)形式的姿态,并在线校准陀螺仪偏差。我们使用可变的加速度测量协方差来确保对临时非重力加速度的稳健性,这些加速度通常会在使用普通算法估计姿态时引入误差。所提出的算法通过仅使用三轴陀螺仪和加速度计实现了准确的陀螺仪在线校准。在陀螺仪测量存在偏差或存在大量临时非重力加速度时,该算法在性能上优于可比较的最新算法。还讨论了一种基于温度的低成本校准方法,用于最初校准陀螺仪和加速度传感器。
惯性测量单元(IMUs)广泛应用于移动机器人技术、航空航天和导航中的姿态估计。IMU由三轴加速度计和三轴陀螺仪组成,用于测量三个正交方向上的加速度和角速度。通过结合积分后的角速度和加速度测量值,可以估计IMU相对于地球坐标系的三维方向,即姿态。微机电系统(MEMS)IMUs是用于姿态估计的小型、轻便和低成本解决方案。它们被广泛应用于移动机器人技术,如无人机(UAVs)[1]。MEMS IMUs也与其他传感器结合使用,如全球导航卫星系统(GNSS)[2, 3]、光探测与测距(LIDAR)传感器或各种应用中的摄像头。此外,MEMS IMUs通常集成在现代手机中[4]。
不幸的是,与高精度测量设备相比,低成本MEMS IMUs的使用引入了一些挑战。低成本MEMS存在噪声,它们的测量通常包含各种误差。这些误差包括未知的零点偏差和未知的比例因子偏差[5]。此外,增益和偏差往往会随时间漂移,并受到温度变化的影响。因此,传感器校准已成为惯性导航中最具挑战性的问题之一[6]。
IMU的其他问题与传感器融合算法的标准设计有关。通常,通过使用地球重力力的测量角度作为参考,来估计横滚和俯仰角,以便将从角速度测量中获得的积分角与之比较。如果系统中不存在除了重力以外的其他力,这种方法就可以完美地工作。不幸的是,这种情况很少出现。在实际应用中,当IMU连接到移动平台或物体时,这些加速度是不可避免的。在各种情况下,比如在估计人体[7]或手机[4]的位置,或者在四足机器人[8]中,这些加速度可能会变得非常大。因此,必须考虑到它们的存在。
标准IMU实现的另一个问题涉及航向角的估计。地球的重力场对此没有提供任何信息。因此,三轴加速度计和陀螺仪的积分无法提供绝对的航向角。通常通过使用额外的传感器来解决这个问题,通常是三轴磁力计[2, 9–16]或卫星导航[3, 5, 17–20]。如果可以信任磁场测量,三轴磁力计提供了一个很好的解决方案。在实践中,至少在机器人技术中通常情况并非如此,因为机器人通常由磁性金属制成,具有高电流电子设备和电机驱动,并且可能在被电线、磁铁和磁性金属包围的地方移动。此外,由于磁传感器观察到由所有磁铁和电感诱导的磁场引起的总场,地球的磁场不能被轻易分离。此外,卫星导航可能帮助有限,因为它在建筑物内部、洞穴内或浓密森林草叶下效果不佳。
📚2 运行结果
原文:

Matlab代码实现:
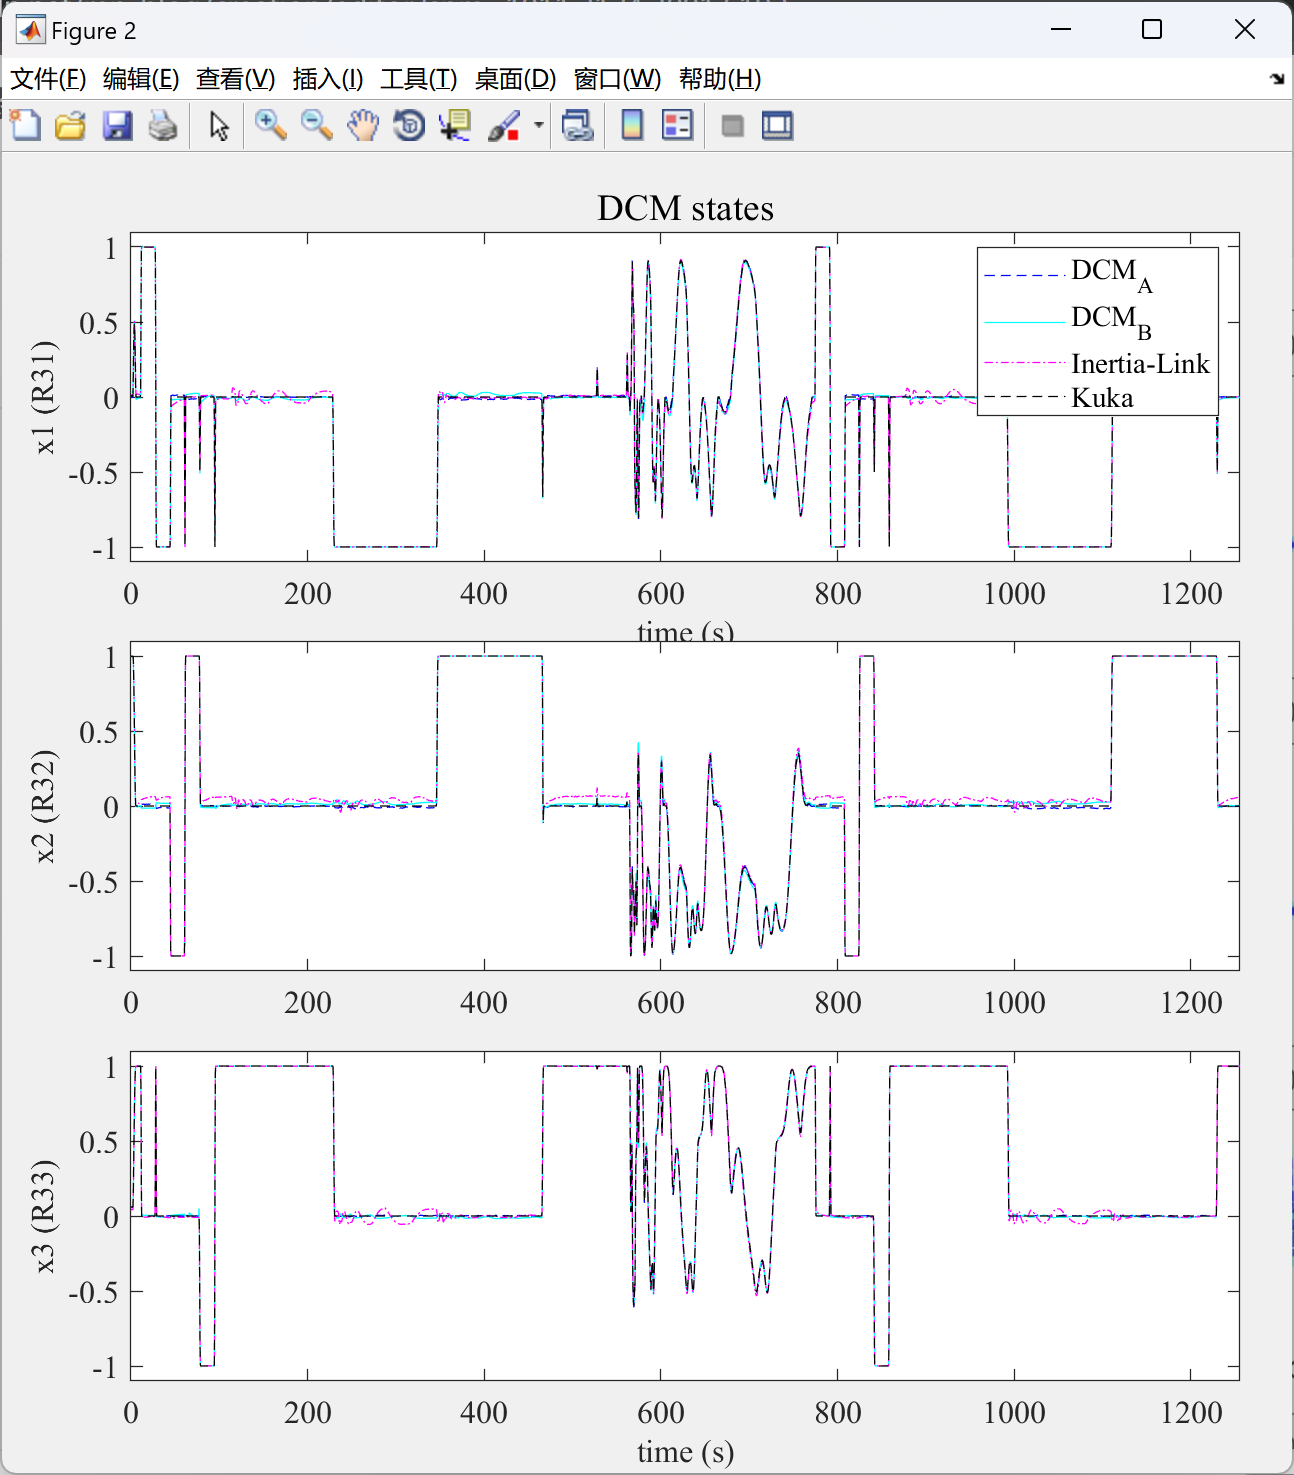


部分代码:
subplot(2,1,2);
boxplot([pitch_DCM_error(rotStartIdx:rotStopIdx), roll_DCM_error(rotStartIdx:rotStopIdx), ...
pitch_mad_A_error(rotStartIdx:rotStopIdx), roll_mad_A_error(rotStartIdx:rotStopIdx), ...
pitch_mah_A_error(rotStartIdx:rotStopIdx), roll_mah_A_error(rotStartIdx:rotStopIdx), ...
pitch_sf_error(rotStartIdx:rotStopIdx), roll_sf_error(rotStartIdx:rotStopIdx), ...
pitch_mad_B_error(rotStartIdx:rotStopIdx), roll_mad_B_error(rotStartIdx:rotStopIdx), ...
pitch_mah_B_error(rotStartIdx:rotStopIdx), roll_mah_B_error(rotStartIdx:rotStopIdx), ...
pitch_IL_error(rotStartIdx:rotStopIdx), roll_IL_error(rotStartIdx:rotStopIdx)], ...
groups_rollpitch, 'whisker', 15);
txt = findobj(gca,'Type','text');
set(txt, 'FontSize', 12, 'FontName', 'Times', 'Interpreter', 'tex', 'VerticalAlignment', 'middle');
set(gca, 'Position', plot22Pos, 'FontSize', 12, 'FontName', 'Times');
ylabel('combined roll and pitch errors (deg)');
set(gcf, 'Position', figPos + [(figIdx-1)*100 0 0 0]);
set(gcf, 'PaperUnits', 'centimeters', 'PaperType', 'A4', 'PaperPosition', [0.63 0.63 19.72 28.41]);
set(gcf,'PaperPositionMode','auto');
saveas(gcf, ['figures/test_fig_' int2str(figIdx) '.fig']);
print('-depsc','-tiff','-r300',['figures/test_fig_' int2str(figIdx) '.eps'])
figIdx = figIdx + 1;
% correlation tests for delays
yaw_ref = yaw_in_IL*180/pi;
pitch_ref = pitch_in_IL*180/pi;
roll_ref = roll_in_IL*180/pi;
yaw_dcm = ypr_hist2(StartIdx:StopIdx,1)*180/pi;
pitch_dcm = ypr_hist2(StartIdx:StopIdx,2)*180/pi;
roll_dcm = ypr_hist2(StartIdx:StopIdx,3)*180/pi;
madgwick = euler_mad_A(StartIdx:StopIdx,:);
mahony = euler_mah_A(StartIdx:StopIdx,:);
yaw_il = yaw_IL(StartIdx:StopIdx)*180/pi;
pitch_il = pitch_IL(StartIdx:StopIdx)*180/pi;
roll_il = roll_IL(StartIdx:StopIdx)*180/pi;
n_lags = 30;
[c_dcm_yaw,lags] = rootMeanSquaredErrors(yaw_dcm, yaw_ref, n_lags);
[min_c_dcm_yaw, min_c_dcm_yaw_idx] = min(c_dcm_yaw);
c_madgwick_yaw = rootMeanSquaredErrors(madgwick(:,3), yaw_ref, n_lags);
[min_c_madgwick_yaw, min_c_madgwick_yaw_idx] = min(c_madgwick_yaw);
c_mahony_yaw = rootMeanSquaredErrors(mahony(:,3), yaw_ref, n_lags);
[min_c_mahony_yaw, min_c_mahony_yaw_idx] = min(c_mahony_yaw);
c_il_yaw = rootMeanSquaredErrors(yaw_il, yaw_ref, n_lags);
[min_c_il_yaw, min_c_il_yaw_idx] = min(c_il_yaw);
c_dcm_pitch = rootMeanSquaredErrors(pitch_dcm, pitch_ref, n_lags);
[min_c_dcm_pitch, min_c_dcm_pitch_idx] = min(c_dcm_pitch);
c_madgwick_pitch = rootMeanSquaredErrors(madgwick(:,2), pitch_ref, n_lags);
[min_c_madgwick_pitch, min_c_madgwick_pitch_idx] = min(c_madgwick_pitch);
c_mahony_pitch = rootMeanSquaredErrors(mahony(:,2), pitch_ref, n_lags);
[min_c_mahony_pitch, min_c_mahony_pitch_idx] = min(c_mahony_pitch);
c_il_pitch = rootMeanSquaredErrors(pitch_il, pitch_ref, n_lags);
[min_c_il_pitch, min_c_il_pitch_idx] = min(c_il_pitch);
c_dcm_roll = rootMeanSquaredErrors(roll_dcm, roll_ref, n_lags);
[min_c_dcm_roll, min_c_dcm_roll_idx] = min(c_dcm_roll);
c_madgwick_roll = rootMeanSquaredErrors(madgwick(:,1), roll_ref, n_lags);
[min_c_madgwick_roll, min_c_madgwick_roll_idx] = min(c_madgwick_roll);
c_mahony_roll = rootMeanSquaredErrors(mahony(:,1), roll_ref, n_lags);
[min_c_mahony_roll, min_c_mahony_roll_idx] = min(c_mahony_roll);
c_il_roll = rootMeanSquaredErrors(roll_il, roll_ref, n_lags);
[min_c_il_roll, min_c_il_roll_idx] = min(c_il_roll);
lags = lags*dt;
% mean squared errors plot
figure(figIdx); clf;
subplot(3,1,1);
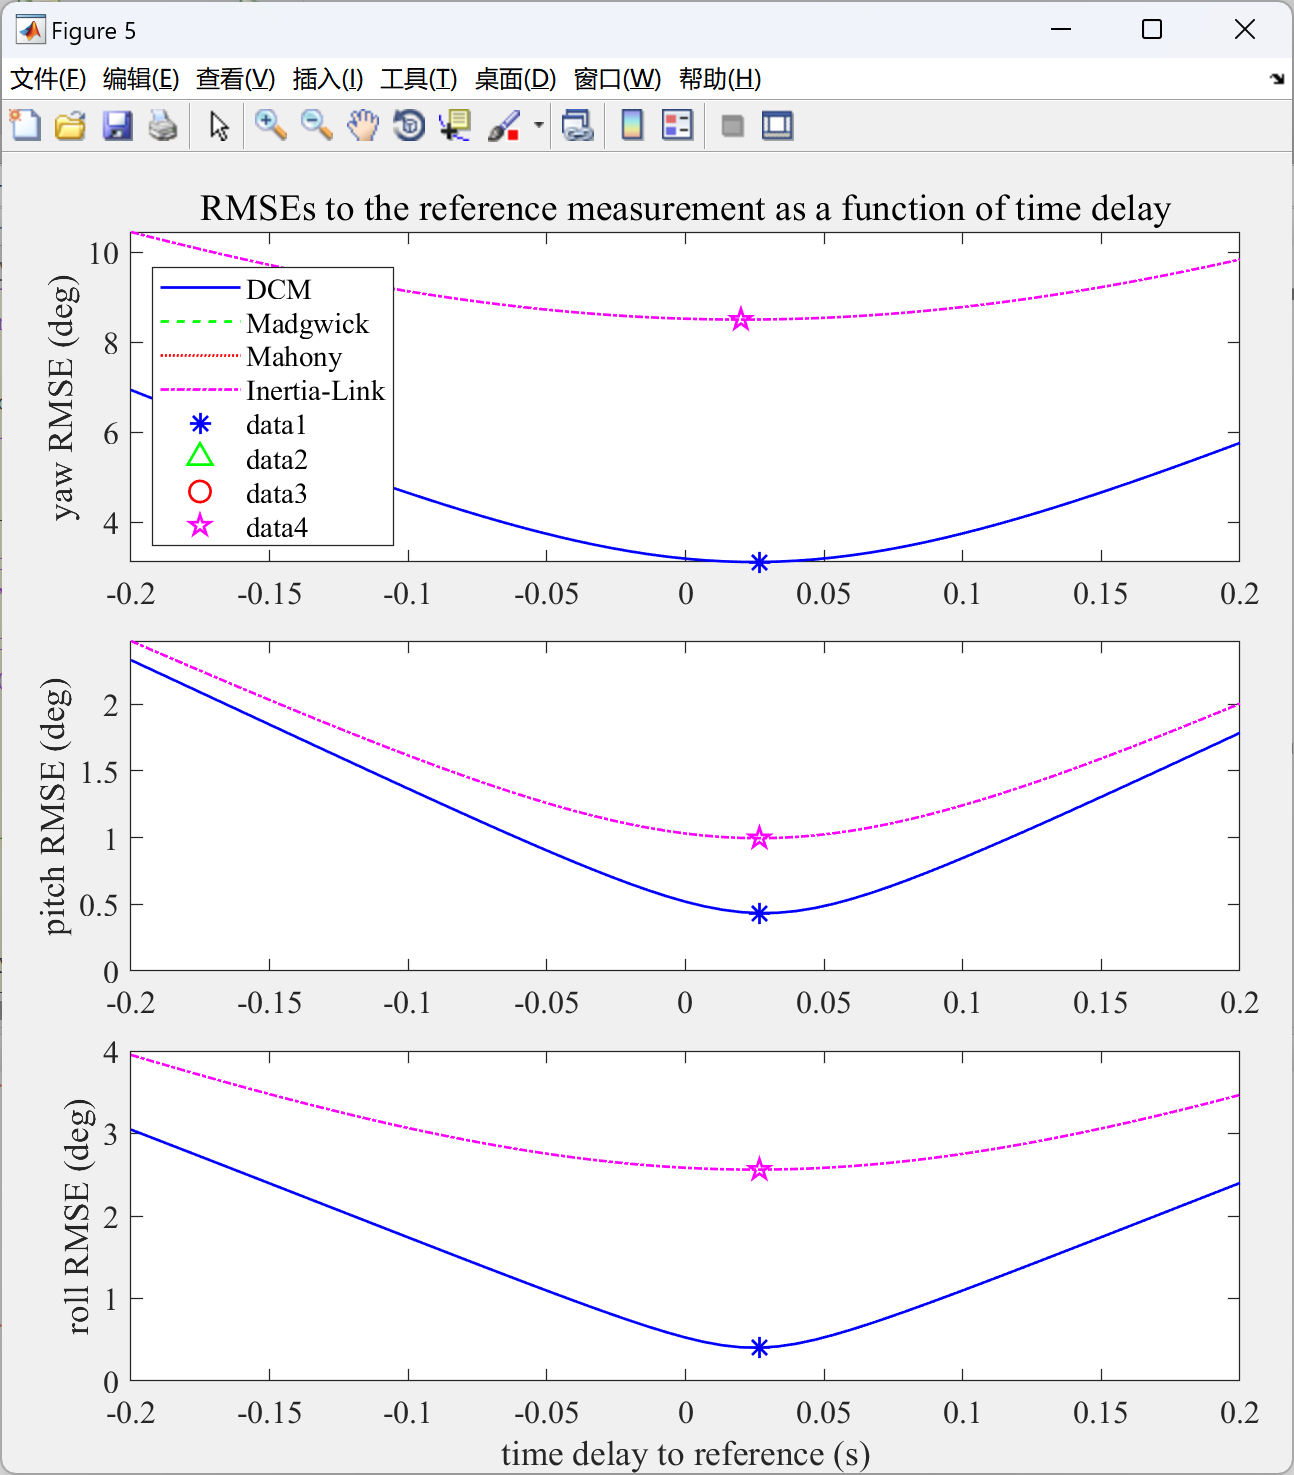
plot(lags, c_dcm_yaw, 'b', lags, c_madgwick_yaw, 'g--', lags, c_mahony_yaw, 'r:', lags, c_il_yaw, 'm-.', 'LineWidth', 1, 'MarkerSize', markerSize);
set(gca, 'Position', plot1Pos, 'FontSize', 12, 'FontName', 'Times');
title('RMSEs to the reference measurement as a function of time delay', 'FontSize', 14, 'FontName', 'Times');
ylabel('yaw RMSE (deg)');
legend('DCM', 'Madgwick', 'Mahony', 'Inertia-Link', 'Location', legendLocation([c_dcm_yaw' c_madgwick_yaw' c_mahony_yaw' c_il_yaw']));
hold on;
plot(lags(min_c_dcm_yaw_idx), c_dcm_yaw(min_c_dcm_yaw_idx), 'b*', ...
lags(min_c_madgwick_yaw_idx), c_madgwick_yaw(min_c_madgwick_yaw_idx), 'g^', ...
lags(min_c_mahony_yaw_idx), c_mahony_yaw(min_c_mahony_yaw_idx), 'ro', ...
lags(min_c_il_yaw_idx), c_il_yaw(min_c_il_yaw_idx), 'mp', 'LineWidth', 1, 'MarkerSize', markerSize);
subplot(3,1,2);
plot(lags, c_dcm_pitch, 'b', lags, c_madgwick_pitch, 'g--', lags, c_mahony_pitch, 'r:', lags, c_il_pitch, 'm-.', 'LineWidth', 1, 'MarkerSize', markerSize);
set(gca, 'Position', plot2Pos, 'FontSize', 12, 'FontName', 'Times');
ylabel('pitch RMSE (deg)');
hold on;
plot(lags(min_c_dcm_pitch_idx), c_dcm_pitch(min_c_dcm_pitch_idx), 'b*', ...
lags(min_c_madgwick_pitch_idx), c_madgwick_pitch(min_c_madgwick_pitch_idx), 'g^', ...
lags(min_c_mahony_pitch_idx), c_mahony_pitch(min_c_mahony_pitch_idx), 'ro', ...
lags(min_c_il_pitch_idx), c_il_pitch(min_c_il_pitch_idx), 'mp', 'LineWidth', 1, 'MarkerSize', markerSize);
subplot(3,1,3);
plot(lags, c_dcm_roll, 'b', lags, c_madgwick_roll, 'g--', lags, c_mahony_roll, 'r:', lags, c_il_roll, 'm-.', 'LineWidth', 1, 'MarkerSize', markerSize);
set(gca, 'Position', plot3Pos, 'FontSize', 12, 'FontName', 'Times');
ylabel('roll RMSE (deg)');
xlabel('time delay to reference (s)');
hold on;
plot(lags(min_c_dcm_roll_idx), c_dcm_roll(min_c_dcm_roll_idx), 'b*', ...
lags(min_c_madgwick_roll_idx), c_madgwick_roll(min_c_madgwick_roll_idx), 'g^', ...
lags(min_c_mahony_roll_idx), c_mahony_roll(min_c_mahony_roll_idx), 'ro', ...
lags(min_c_il_roll_idx), c_il_roll(min_c_il_roll_idx), 'mp', 'LineWidth', 1, 'MarkerSize', markerSize);
set(gcf, 'Position', figPos + [(figIdx-1)*100 0 0 0]);
set(gcf, 'PaperUnits', 'centimeters', 'PaperType', 'A4', 'PaperPosition', [0.63 0.63 19.72 28.41]);
set(gcf,'PaperPositionMode','auto');
saveas(gcf, ['figures/test_fig_' int2str(figIdx) '.fig']);
print('-depsc','-tiff','-r300',['figures/test_fig_' int2str(figIdx) '.eps'])
figIdx = figIdx + 1;
% Yaw, pitch and roll plot
figure(figIdx); clf;
subplot(3,1,1);
plot(time, yaw_dcm, 'b', time, madgwick(:,3), 'g--', time, mahony(:,3), 'r:', time, yaw_il, 'm-.', time, yaw_ref, 'k--', 'LineWidth', 1);
set(gca, 'Position', plot1Pos, 'FontSize', 12, 'FontName', 'Times');
legend('DCM', 'Madgwick', 'Mahony', 'Inertia-Link', 'Reference', 'Location', legendLocation([yaw_dcm yaw_ref madgwick(:,3) mahony(:,3)]));
hold on;
maxY = max([max(yaw_dcm), max(madgwick(:,3)), max(mahony(:,3)), max(yaw_il), max(yaw_ref)]);
maxY = max([1.1*maxY 0.9*maxY]);
minY = min([min(yaw_dcm), min(madgwick(:,3)), min(mahony(:,3)), min(yaw_il), min(yaw_ref)]);
minY = min([1.1*minY 0.9*minY]);
plot(time([accStartIdx accStartIdx]), [minY maxY], 'k:', time([accStopIdx accStopIdx]), [minY maxY], 'k:', 'LineWidth', 1);
plot(time([rotStartIdx rotStartIdx]), [minY maxY], 'k:', time([rotStopIdx rotStopIdx]), [minY maxY], 'k:', 'LineWidth', 1);
ylabel('yaw (deg)', 'FontSize', 12, 'FontName', 'Times');
title('Euler angles', 'FontSize', 14, 'FontName', 'Times');
axis([time(1) time(end) minY maxY]);
subplot(3,1,2);
plot(time, pitch_dcm, 'b', time, madgwick(:,2), 'g--', time, mahony(:,2), 'r:', time, pitch_il, 'm-.', time, pitch_ref, 'k--', 'LineWidth', 1);
hold on;
maxY = max([max(pitch_dcm), max(madgwick(:,2)), max(mahony(:,2)), max(pitch_il), max(pitch_ref)]);
maxY = max([1.1*maxY 0.9*maxY]);
minY = min([min(pitch_dcm), min(madgwick(:,2)), min(mahony(:,2)), min(pitch_il), min(pitch_ref)]);
minY = min([1.1*minY 0.9*minY]);
plot(time([accStartIdx accStartIdx]), [minY maxY], 'k:', time([accStopIdx accStopIdx]), [minY maxY], 'k:', 'LineWidth', 1);
plot(time([rotStartIdx rotStartIdx]), [minY maxY], 'k:', time([rotStopIdx rotStopIdx]), [minY maxY], 'k:', 'LineWidth', 1);
set(gca, 'Position', plot2Pos, 'FontSize', 12, 'FontName', 'Times');
ylabel('pitch (deg)', 'FontSize', 12, 'FontName', 'Times');
axis([time(1) time(end) minY maxY]);
subplot(3,1,3);
plot(time, roll_dcm, 'b', time, madgwick(:,1), 'g--', time, mahony(:,1), 'r:', time, roll_il, 'm-.', time, roll_ref, 'k--', 'LineWidth', 1);
set(gca, 'Position', plot3Pos, 'FontSize', 12, 'FontName', 'Times');
hold on;
maxY = max([max(roll_dcm), max(madgwick(:,1)), max(mahony(:,1)), max(roll_il), max(roll_ref)]);
maxY = max([1.1*maxY 0.9*maxY]);
minY = min([min(roll_dcm), min(madgwick(:,1)), min(mahony(:,1)), min(roll_il), min(roll_ref)]);
minY = min([1.1*minY 0.9*minY]);
arrowOffset = 5;
plot(time([accStartIdx accStartIdx]), [minY maxY], 'k:', time([accStopIdx accStopIdx]), [minY maxY], 'k:', 'LineWidth', 1);
plot([time(accStartIdx)+arrowOffset time(accStopIdx)-arrowOffset], [minY minY]+arrowOffset, 'k:', ...
time(accStartIdx)+arrowOffset, minY+arrowOffset, 'k<', time(accStopIdx)-arrowOffset, minY+arrowOffset, 'k>', 'LineWidth', 1, 'MarkerSize', markerSize);
text(time(accStartIdx)+2*arrowOffset, minY-arrowOffset, 'Acceleration test', 'FontSize', 12, 'FontName', 'Times');
plot(time([rotStartIdx rotStartIdx]), [minY maxY], 'k:', time([rotStopIdx rotStopIdx]), [minY maxY], 'k:', 'LineWidth', 1);
plot([time(rotStartIdx)+arrowOffset time(rotStopIdx)-arrowOffset], [minY minY]+arrowOffset, 'k:', ...
time(rotStartIdx)+arrowOffset, minY+arrowOffset, 'k<', time(rotStopIdx)-arrowOffset, minY+arrowOffset, 'k>', 'LineWidth', 1, 'MarkerSize', markerSize);
text(time(rotStartIdx)+2*arrowOffset, minY-arrowOffset, 'Rotation test', 'FontSize', 12, 'FontName', 'Times');
xlabel('time (s)', 'FontSize', 12, 'FontName', 'Times');
ylabel('roll (deg)', 'FontSize', 12, 'FontName', 'Times');
axis([time(1) time(end) minY-20 maxY]);
set(gcf, 'Position', figPos + [(figIdx-1)*100 0 0 0]);
set(gcf, 'PaperUnits', 'centimeters', 'PaperType', 'A4', 'PaperPosition', [0.63 0.63 19.72 28.41]);
set(gcf,'PaperPositionMode','auto');
saveas(gcf, ['figures/test_fig_' int2str(figIdx) '.fig']);
print('-depsc','-tiff','-r300',['figures/test_fig_' int2str(figIdx) '.eps'])
figIdx = figIdx + 1;
% error plot with reference
figure(figIdx); clf;
subplot(4,1,1);
plot(time, yaw_ref, 'b', time, pitch_ref, 'g--', time, roll_ref, 'r:', 'LineWidth', 1);
set(gca, 'Position', plot41Pos, 'FontSize', 12, 'FontName', 'Times');
legend('yaw', 'pitch', 'roll', 'Location', legendLocation([yaw_ref pitch_ref roll_ref]));
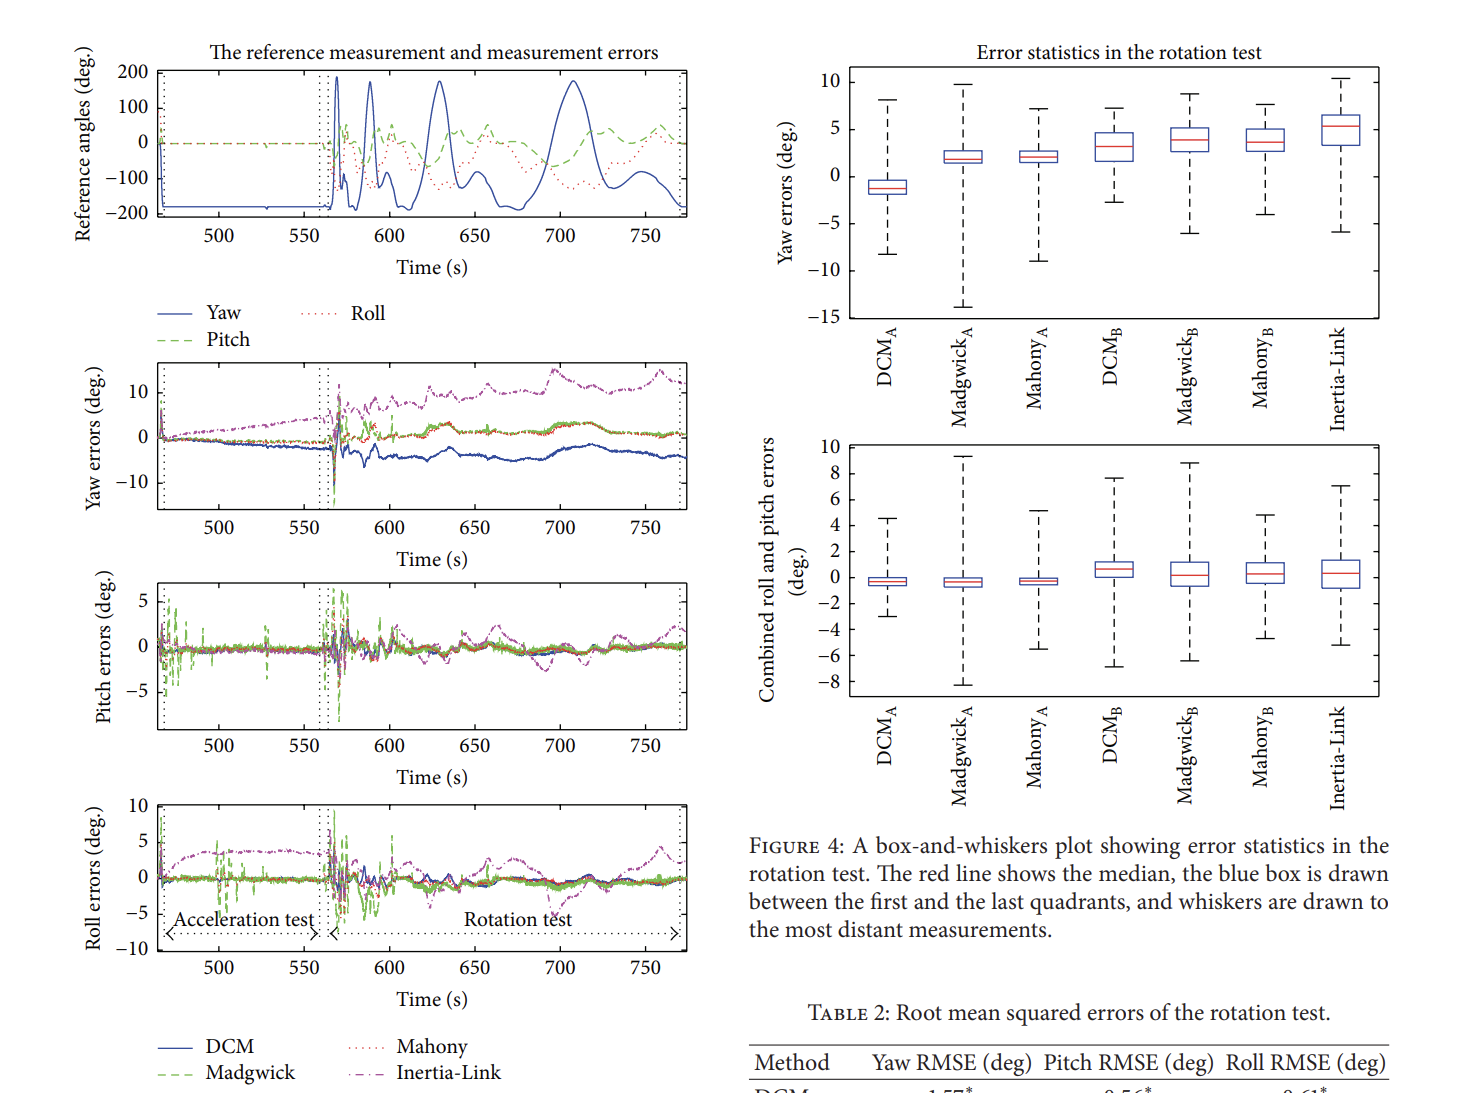
title('The reference measurement and measurement errors', 'FontSize', 14, 'FontName', 'Times');
ylabel('reference angles (deg)', 'FontSize', 12, 'FontName', 'Times');
hold on;
maxY = max([max(yaw_ref), max(pitch_ref), max(roll_ref)]);
maxY = max([1.1*maxY 0.9*maxY]);
minY = min([min(yaw_ref), min(pitch_ref), min(roll_ref)]);
minY = min([1.1*minY 0.9*minY]);
arrowOffset = 5;
plot(time([accStartIdx accStartIdx]), [minY maxY], 'k:', time([accStopIdx accStopIdx]), [minY maxY], 'k:', 'LineWidth', 1);
plot(time([rotStartIdx rotStartIdx]), [minY maxY], 'k:', time([rotStopIdx rotStopIdx]), [minY maxY], 'k:', 'LineWidth', 1);
axis([time(1) time(end) minY maxY]);
subplot(4,1,2);
plot(time, yaw_DCM_error, 'b', time, yaw_mad_A_error, 'g--', time, yaw_mah_A_error, 'r:', time, yaw_IL_error, 'm-.', 'LineWidth', 1, 'EraseMode', 'xor');
set(gca, 'Position', plot42Pos, 'FontSize', 12, 'FontName', 'Times');
legend('DCM', 'Madgwick', 'Mahony', 'Inertia-Link', 'Location', legendLocation([yaw_DCM_error yaw_IL_error yaw_mad_A_error yaw_mah_A_error]));
hold on;
ylabel('yaw errors (deg)', 'FontSize', 12, 'FontName', 'Times');
set(gca, 'XLim', [time(1) time(end)]);
maxY = max([max(yaw_DCM_error), max(yaw_mad_A_error), max(yaw_mah_A_error), max(yaw_IL_error)]);
maxY = max([1.1*maxY 0.9*maxY]);
minY = min([min(yaw_DCM_error), min(yaw_mad_A_error), min(yaw_mah_A_error), min(yaw_IL_error)]);
minY = min([1.1*minY 0.9*minY]);
plot(time([accStartIdx accStartIdx]), [minY maxY], 'k:', time([accStopIdx accStopIdx]), [minY maxY], 'k:', 'LineWidth', 1);
plot(time([rotStartIdx rotStartIdx]), [minY maxY], 'k:', time([rotStopIdx rotStopIdx]), [minY maxY], 'k:', 'LineWidth', 1);
axis([time(1) time(end) minY maxY]);
subplot(4,1,3);
plot(time, pitch_DCM_error, 'b', time, pitch_mad_A_error, 'g--', time, pitch_mah_A_error, 'r:', time, pitch_IL_error, 'm-.', 'LineWidth', 1, 'EraseMode', 'xor');
hold on;
set(gca, 'Position', plot43Pos, 'FontSize', 12, 'FontName', 'Times');
ylabel('pitch errors (deg)', 'FontSize', 12, 'FontName', 'Times');
maxY = max([max(pitch_DCM_error), max(pitch_mad_A_error), max(pitch_mah_A_error), max(pitch_IL_error)]);
maxY = max([1.1*maxY 0.9*maxY]);
minY = min([min(pitch_DCM_error), min(pitch_mad_A_error), min(pitch_mah_A_error), min(pitch_IL_error)]);
minY = min([1.1*minY 0.9*minY]);
plot(time([accStartIdx accStartIdx]), [minY maxY], 'k:', time([accStopIdx accStopIdx]), [minY maxY], 'k:', 'LineWidth', 1);
plot(time([rotStartIdx rotStartIdx]), [minY maxY], 'k:', time([rotStopIdx rotStopIdx]), [minY maxY], 'k:', 'LineWidth', 1);
axis([time(1) time(end) minY maxY]);
subplot(4,1,4);
plot(time, roll_DCM_error, 'b', time, roll_mad_A_error, 'g--', time, roll_mah_A_error, 'r:', time, roll_IL_error, 'm-.', 'LineWidth', 1, 'EraseMode', 'xor');
hold on;
set(gca, 'Position', plot44Pos, 'FontSize', 12, 'FontName', 'Times');
xlabel('time (s)', 'FontSize', 12, 'FontName', 'Times');
ylabel('roll errors (deg)', 'FontSize', 12, 'FontName', 'Times');
maxY = max([max(roll_DCM_error), max(roll_mad_A_error), max(roll_mah_A_error), max(roll_IL_error)]);
maxY = max([1.1*maxY 0.9*maxY]);
minY = min([min(roll_DCM_error), min(roll_mad_A_error), min(roll_mah_A_error), min(roll_IL_error)]);
minY = min([1.1*minY 0.9*minY]);
arrowOffset_y = 0.5;
plot(time([accStartIdx accStartIdx]), [minY maxY], 'k:', time([accStopIdx accStopIdx]), [minY maxY], 'k:', 'LineWidth', 1);
plot([time(accStartIdx)+arrowOffset time(accStopIdx)-arrowOffset], [minY minY]+arrowOffset_y, 'k:', ...
time(accStartIdx)+arrowOffset, minY+arrowOffset_y, 'k<', time(accStopIdx)-arrowOffset, minY+arrowOffset_y, 'k>', 'LineWidth', 1, 'MarkerSize', markerSize);
text(time(accStartIdx)+2*arrowOffset, minY-arrowOffset_y, 'Acceleration test', 'FontSize', 12, 'FontName', 'Times');
plot(time([rotStartIdx rotStartIdx]), [minY maxY], 'k:', time([rotStopIdx rotStopIdx]), [minY maxY], 'k:', 'LineWidth', 1);
plot([time(rotStartIdx)+arrowOffset time(rotStopIdx)-arrowOffset], [minY minY]+arrowOffset_y, 'k:', ...
time(rotStartIdx)+arrowOffset, minY+arrowOffset_y, 'k<', time(rotStopIdx)-arrowOffset, minY+arrowOffset_y, 'k>', 'LineWidth', 1, 'MarkerSize', markerSize);
text(time(rotStartIdx)+2*arrowOffset, minY-arrowOffset_y, 'Rotation test', 'FontSize', 12, 'FontName', 'Times');
axis([time(1) time(end) minY-4*arrowOffset_y maxY]);
set(gcf, 'Position', figPos + [(figIdx-1)*100 0 0 150]);
set(gcf, 'PaperUnits', 'centimeters', 'PaperType', 'A4', 'PaperPosition', [0.63 0.63 19.72 28.41]);
set(gcf,'PaperPositionMode','auto');
saveas(gcf, ['figures/test_fig_' int2str(figIdx) '.fig']);
print('-depsc','-tiff','-r300',['figures/test_fig_' int2str(figIdx) '.eps'])
figIdx = figIdx + 1;
% bias plot (states with variances)
figure(figIdx); clf;
x_sigma = sqrt(P_diag_hist2(StartIdx:StopIdx,4));
y_sigma = sqrt(P_diag_hist2(StartIdx:StopIdx,5));
z_sigma = sqrt(P_diag_hist2(StartIdx:StopIdx,6));
plotLims = 1.25*[mean(x_sigma), mean(y_sigma), mean(z_sigma)];
bias_x = x_hist2(StartIdx:StopIdx,4)*180/pi;
bias_y = x_hist2(StartIdx:StopIdx,5)*180/pi;
bias_z = x_hist2(StartIdx:StopIdx,6)*180/pi;
subplot(3,1,1);
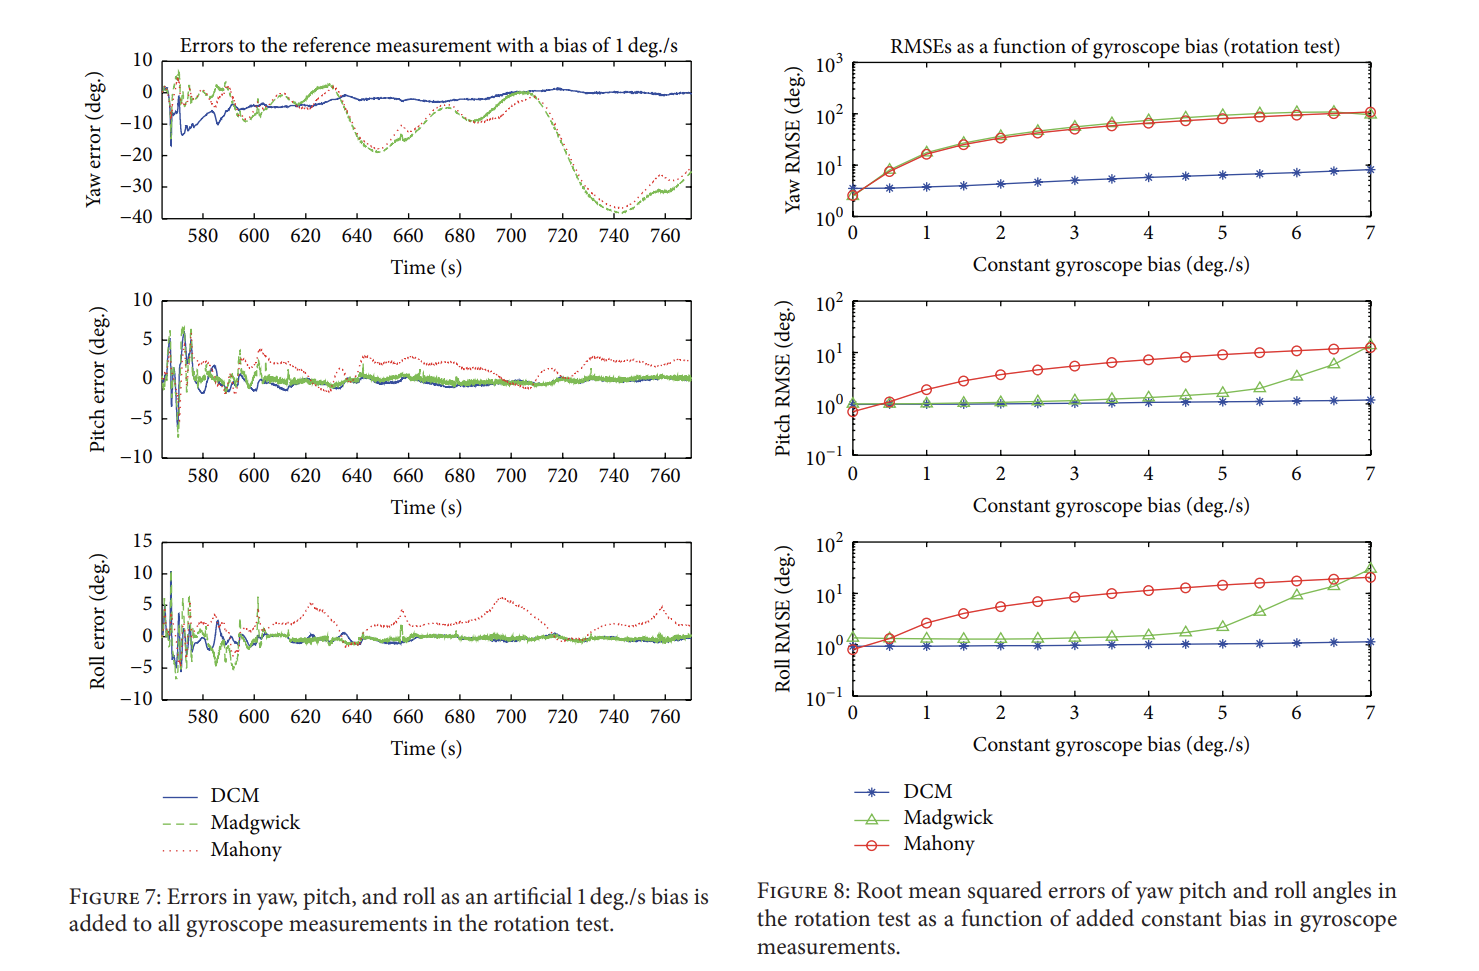
plot([time(1) time(end)], [addedGyroBias addedGyroBias]*180/pi, 'k--', ...
time, bias_x, 'b', time, (addedGyroBias-x_sigma)*180/pi, 'b-.', ...
time, (addedGyroBias+x_sigma)*180/pi, 'b-.', 'LineWidth', 1, 'MarkerSize', markerSize);
h = legend('Reference', 'Estimate', '1-sigma');
set(gca, 'Position', plot1Pos, 'FontSize', 12, 'FontName', 'Times');
ylabel('x_b_i_a_s (deg/s)', 'FontSize', 12, 'FontName', 'Times');
title('Bias estimates and 1-sigma distances of standard deviations', 'FontSize', 14, 'FontName', 'Times');
set(gca, 'XLim', [time(1) time(end)], 'YLim', [addedGyroBias-plotLims(1) addedGyroBias+plotLims(1)]*180/pi);
subplot(3,1,2);
plot([time(1) time(end)], [addedGyroBias addedGyroBias]*180/pi, 'k--', ...
time, bias_y, 'b', time, (addedGyroBias-y_sigma)*180/pi, 'b-.', ...
time, (addedGyroBias+y_sigma)*180/pi, 'b-.', 'LineWidth', 1, 'MarkerSize', markerSize);
set(gca, 'Position', plot2Pos, 'FontSize', 12, 'FontName', 'Times');
ylabel('y_b_i_a_s (deg/s)', 'FontSize', 12, 'FontName', 'Times');
set(gca, 'XLim', [time(1) time(end)], 'YLim', [addedGyroBias-plotLims(2) addedGyroBias+plotLims(2)]*180/pi);
subplot(3,1,3);
plot([time(1) time(end)], [addedGyroBias addedGyroBias]*180/pi, 'k--', ...
time, bias_z, 'b', time, (addedGyroBias-z_sigma)*180/pi, 'b-.', ...
time, (addedGyroBias+z_sigma)*180/pi, 'b-.', 'LineWidth', 1, 'MarkerSize', markerSize);
set(gca, 'Position', plot3Pos, 'FontSize', 12, 'FontName', 'Times');
xlabel('time (s)', 'FontSize', 12, 'FontName', 'Times');
ylabel('z_b_i_a_s (deg/s)', 'FontSize', 12, 'FontName', 'Times');
set(gca, 'XLim', [time(1) time(end)], 'YLim', [addedGyroBias-plotLims(3) addedGyroBias+plotLims(3)]*180/pi);
set(gcf, 'Position', figPos + [(figIdx-1)*100 0 0 0]);
set(gcf, 'PaperUnits', 'centimeters', 'PaperType', 'A4', 'PaperPosition', [0.63 0.63 19.72 28.41]);
set(gcf,'PaperPositionMode','auto');
saveas(gcf, ['figures/test_fig_' int2str(figIdx) '.fig']);
print('-depsc','-tiff','-r300',['figures/test_fig_' int2str(figIdx) '.eps'])
🎉3 参考文献
文章中一些内容引自网络,会注明出处或引用为参考文献,难免有未尽之处,如有不妥,请随时联系删除。


 1万+
1万+


 被折叠的 条评论
为什么被折叠?
被折叠的 条评论
为什么被折叠?
 到【灌水乐园】发言


