


👨🎓个人主页:研学社的博客
💥💥💞💞欢迎来到本博客❤️❤️💥💥
🏆博主优势:🌞🌞🌞博客内容尽量做到思维缜密,逻辑清晰,为了方便读者。
⛳️座右铭:行百里者,半于九十。
📋📋📋本文目录如下:🎁🎁🎁
目录
💥1 概述
文献来源:

摘要:本文提出了一种基于“条件局部峰值率”(CLPR)的信号变化/事件/异常检测方法。首先对CLPR特征进行了描述,并在此基础上介绍了该方法。CLPR计算算法作为用户自定义函数在Matlab®软件环境中实现,并使用实际数据进行了多次数值实验以进行验证和验证。将该方法与基于短时能量、短时过零率和短时峰度的三种经典检测方法进行了性能比较,结果表明了该方法的优越性。Matlab®实现的可访问性允许实验的可重复性,并促进该方法的实际应用。
关键词:时域,信号,数据,变化,事件,异常,检测。
原文摘要:
Abstract – In this paper, we present a method for signal change/event/anomaly detection based on a novel time-domain feature termed “conditional local peaks rate” (CLPR). First, the CLPR feature is described and further the method is introduced based on it. The CLPR calculation algorithm is implemented in the Matlab® software environment as a user-defined function and several numerical experiments are conducted with real-world data for sake of verification and validation. The performance of the proposed method is compared with three other classic detection methods based on the short-time energy, short-time zero-crossing rate and short-time kurtosis and the obtained results indicate its advantages. The accessibility of the Matlab® implementation allows repeatability of the experiments and facilitates the real practical application of the method. Keywords: time domain, signal, data, change, event, anomaly, detection.
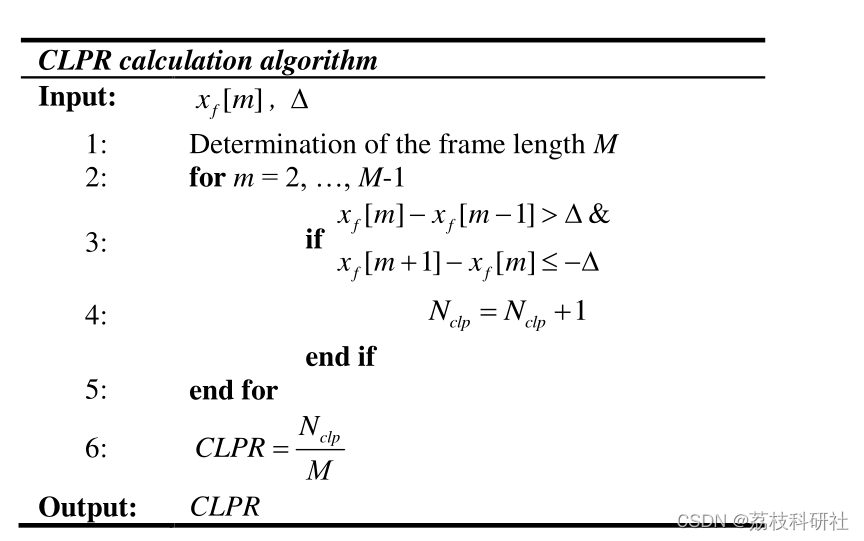
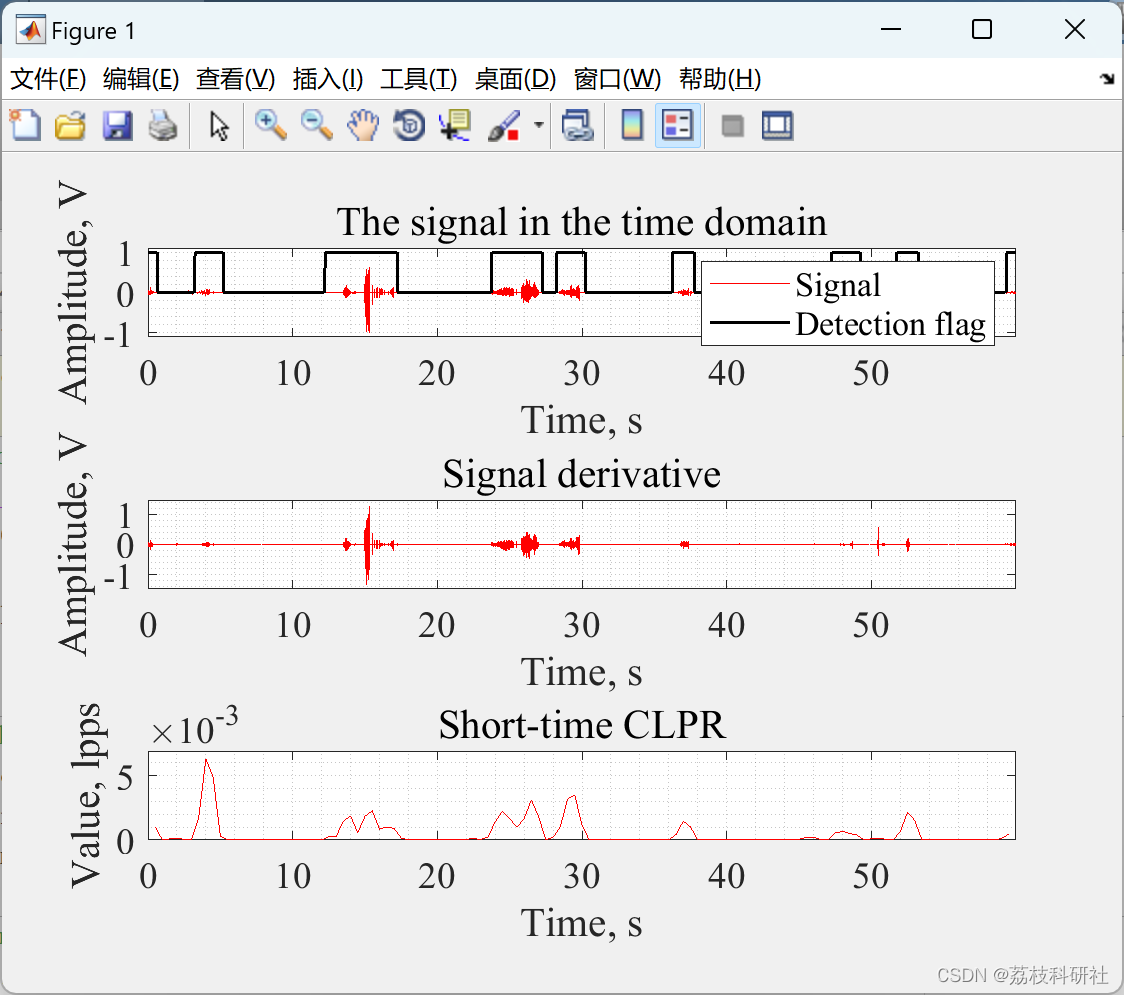
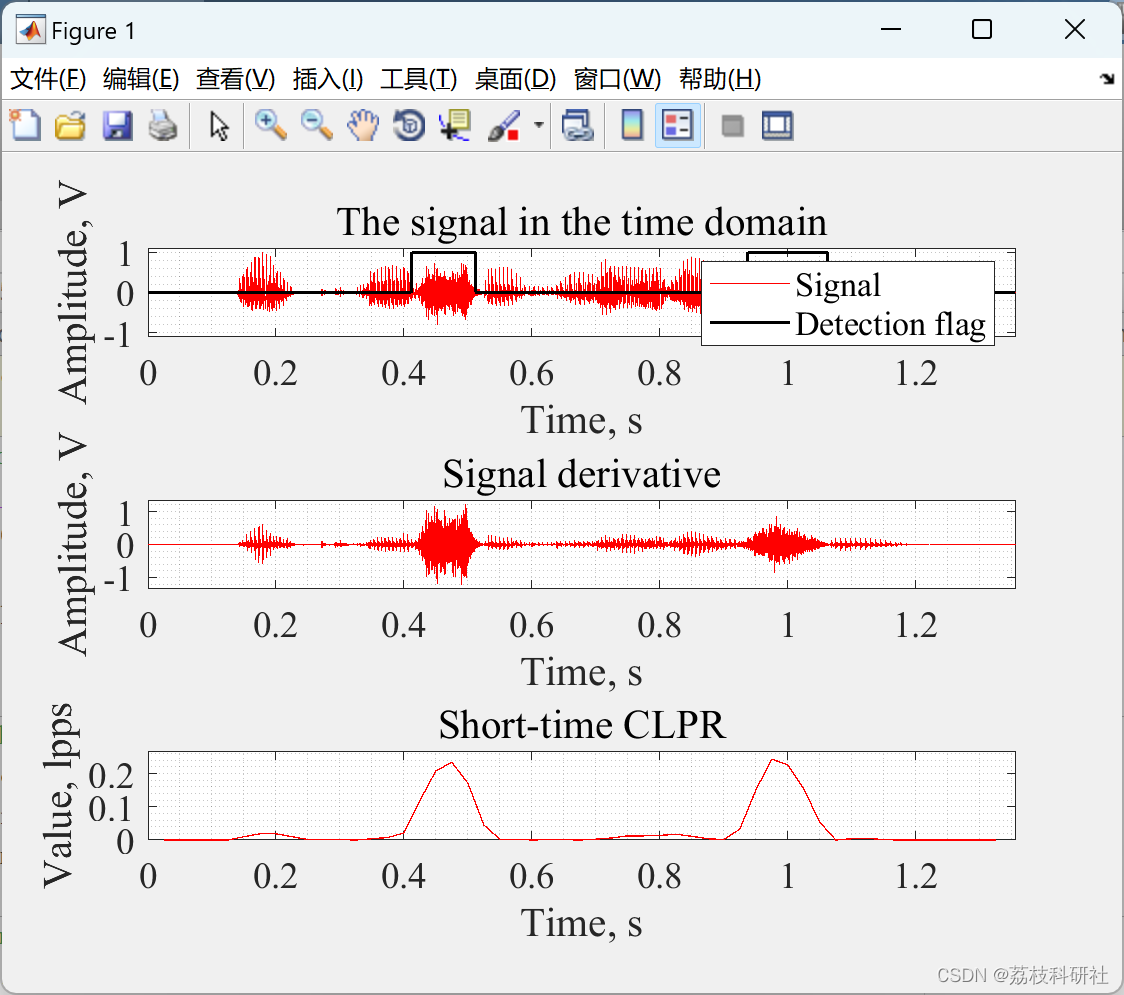
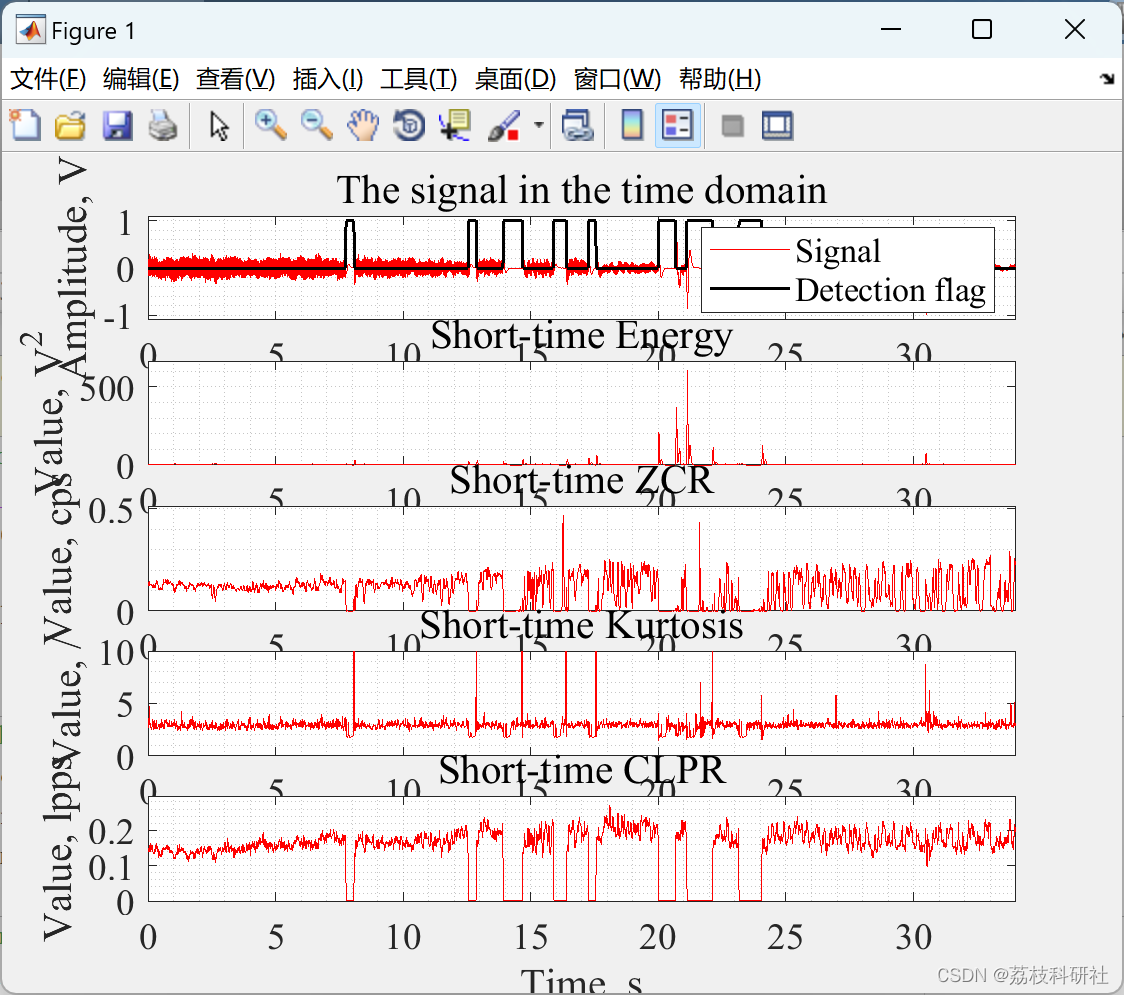
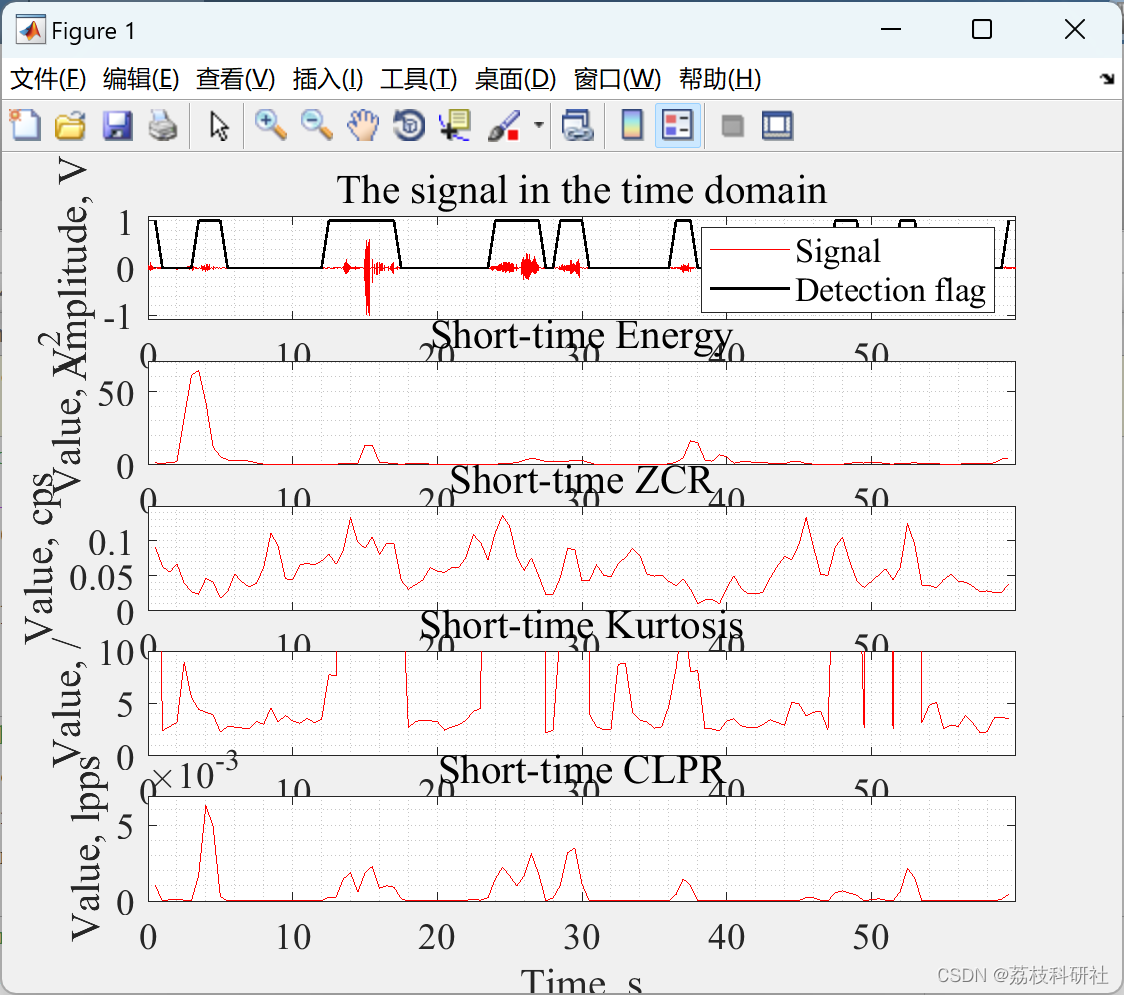
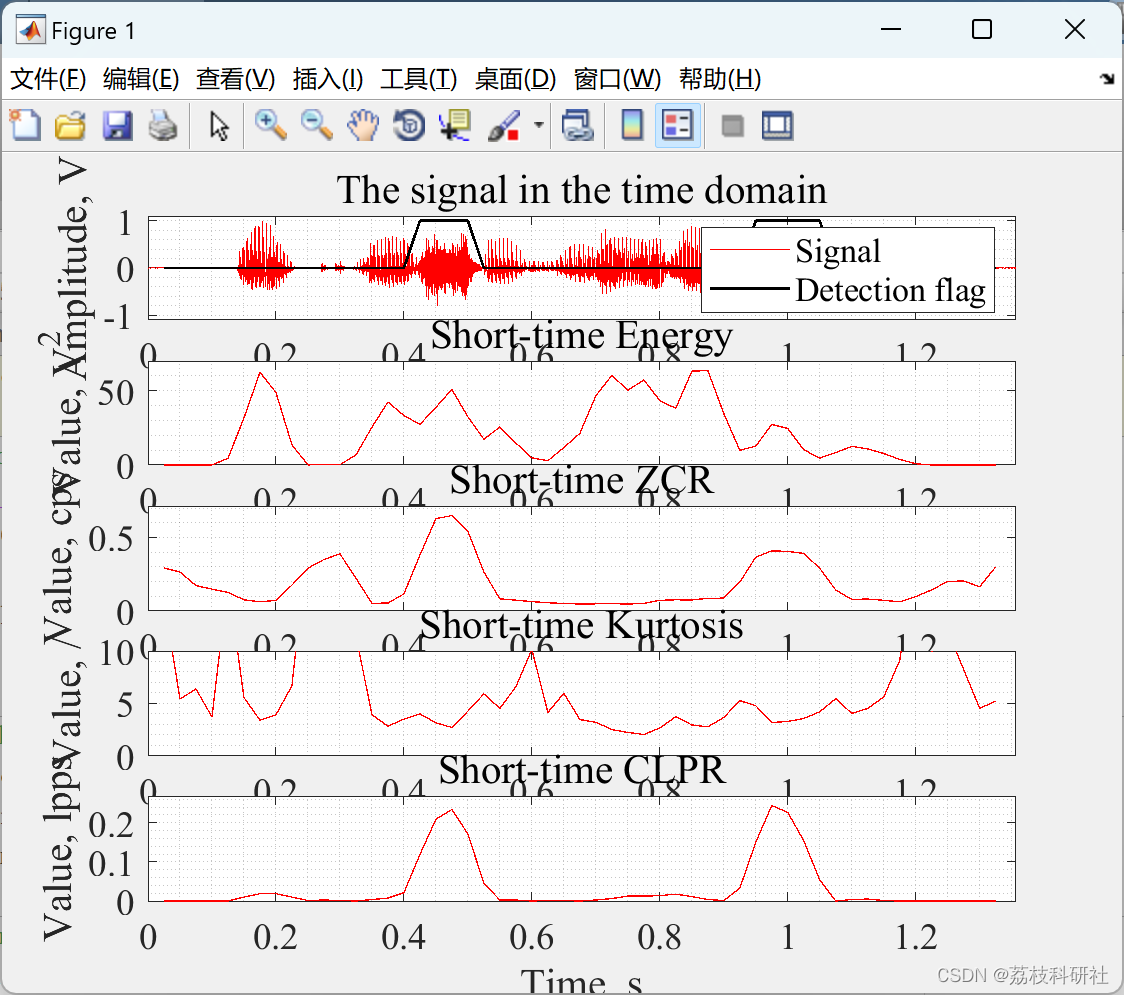
本文使用逐帧方法和名为“条件局部峰值速率”(CLPR) 的新颖信号特征实现了一种新的基于时域的信号变化检测方法——本地信号峰值的速率高于其邻居的某个预定义阈值水平。所提出的特征的基本单位是“每个样品的局部峰”(lpps)。
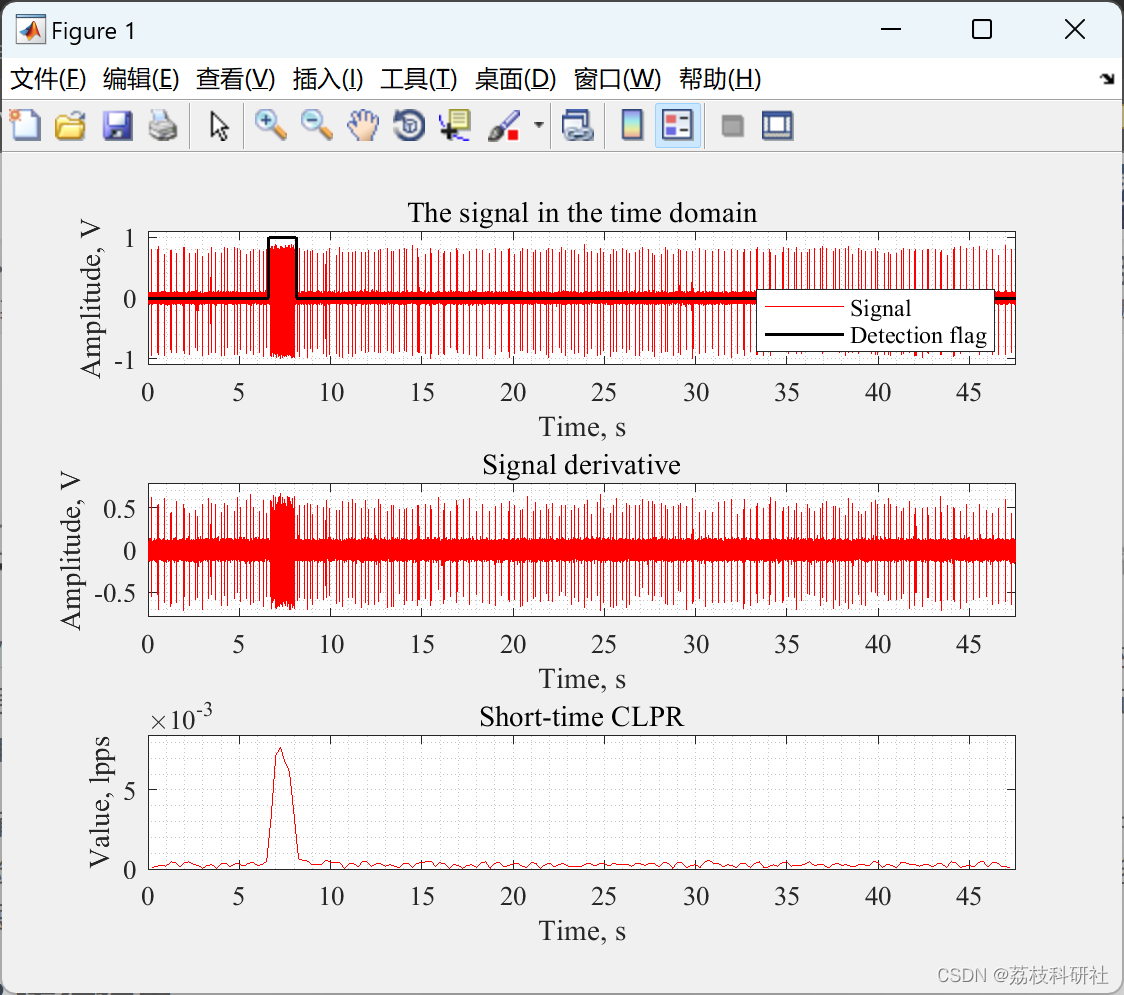
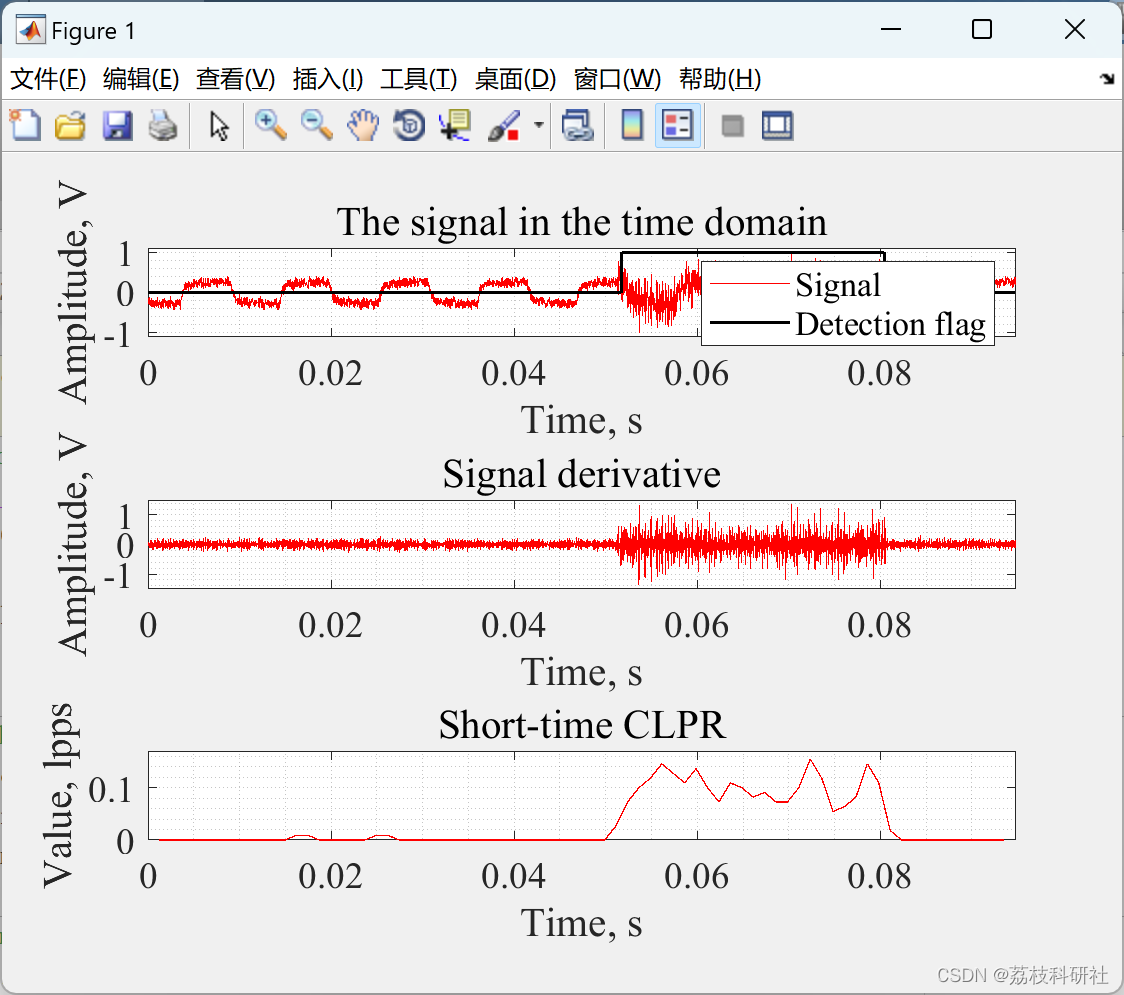
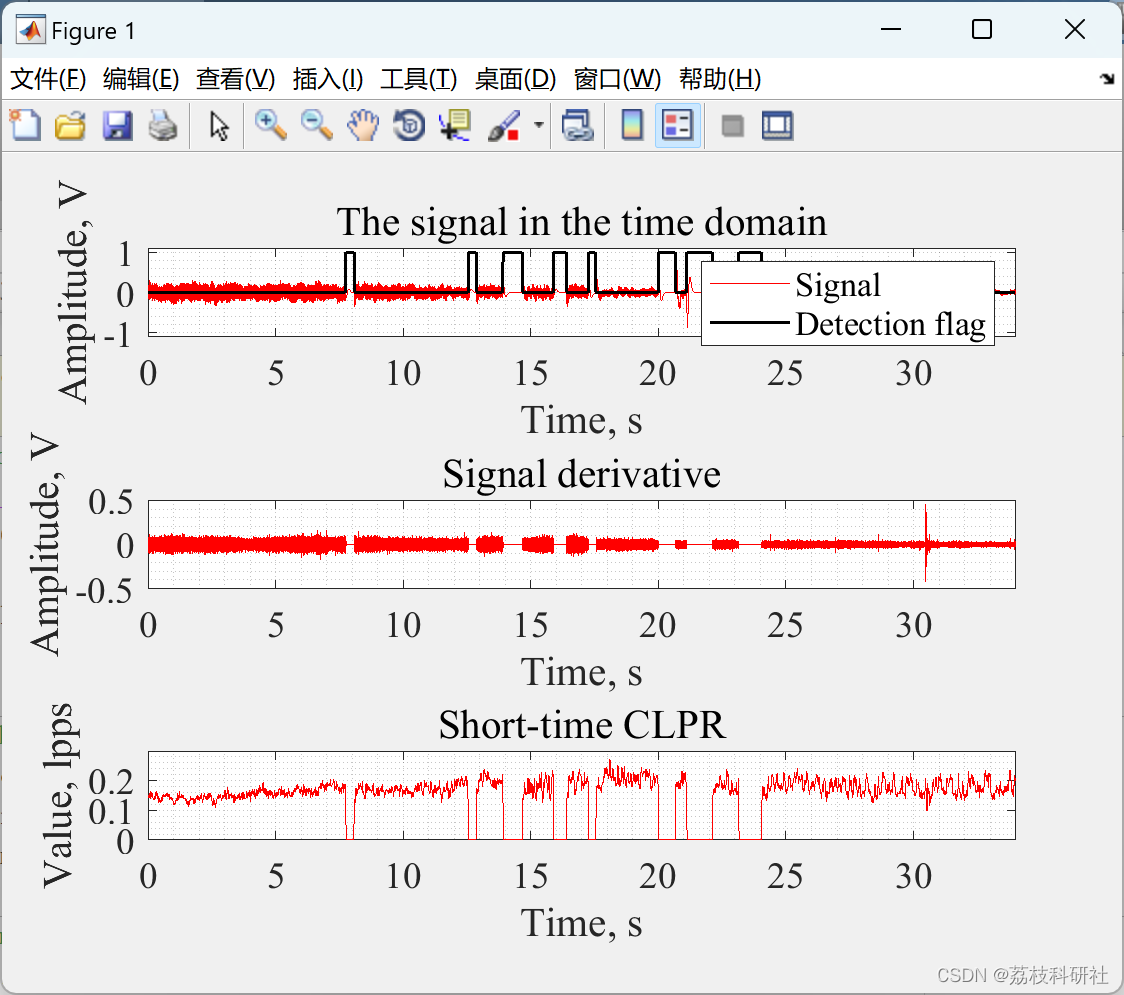
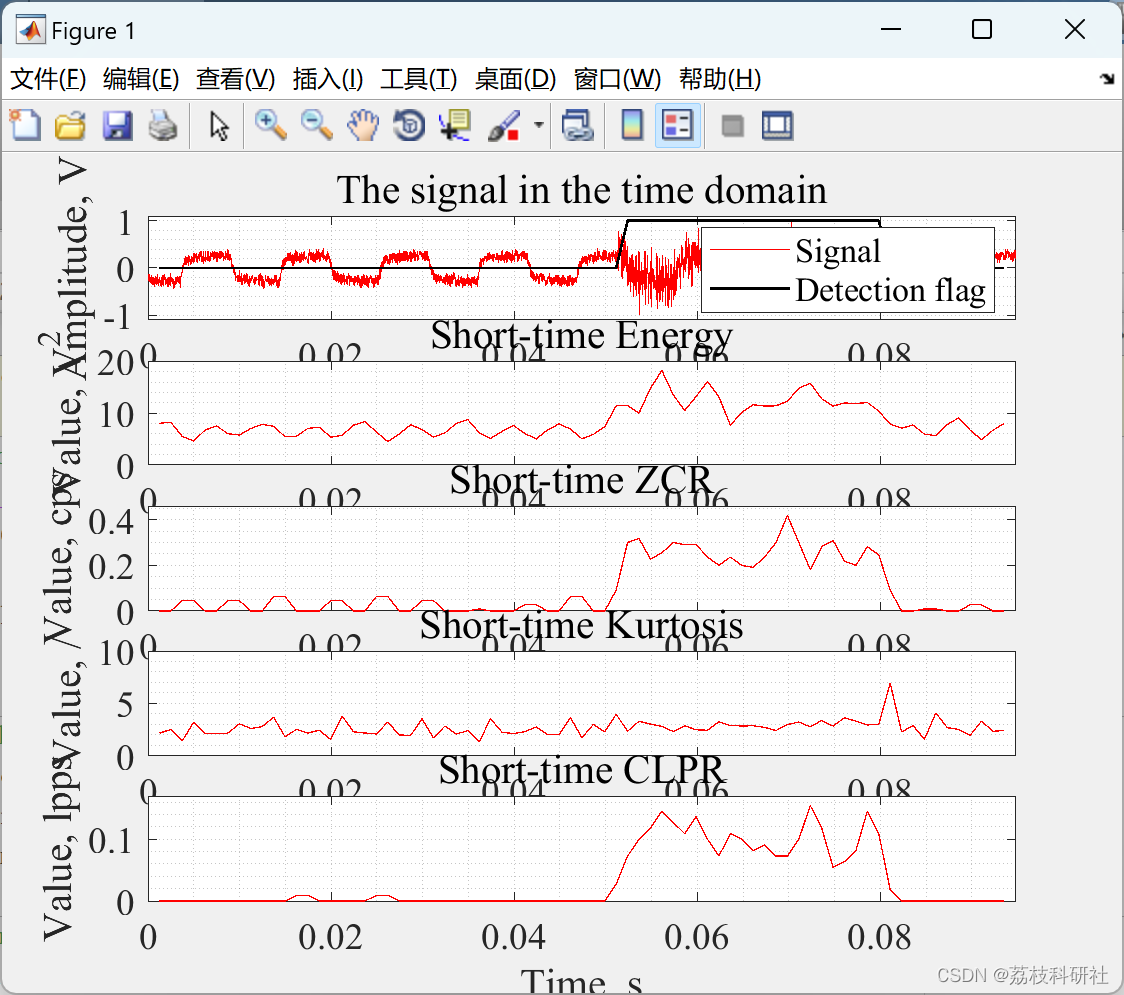
为了阐明函数的用法,给出了几个实际示例。它们表明,CLPR可以作为数据中各种异常或事件的良好检测过程。这些例子表明,在大多数情况下,CLPR优于经典的变化检测方法——短时间能量、短时间过零率和短时间峰度。
📚2 运行结果
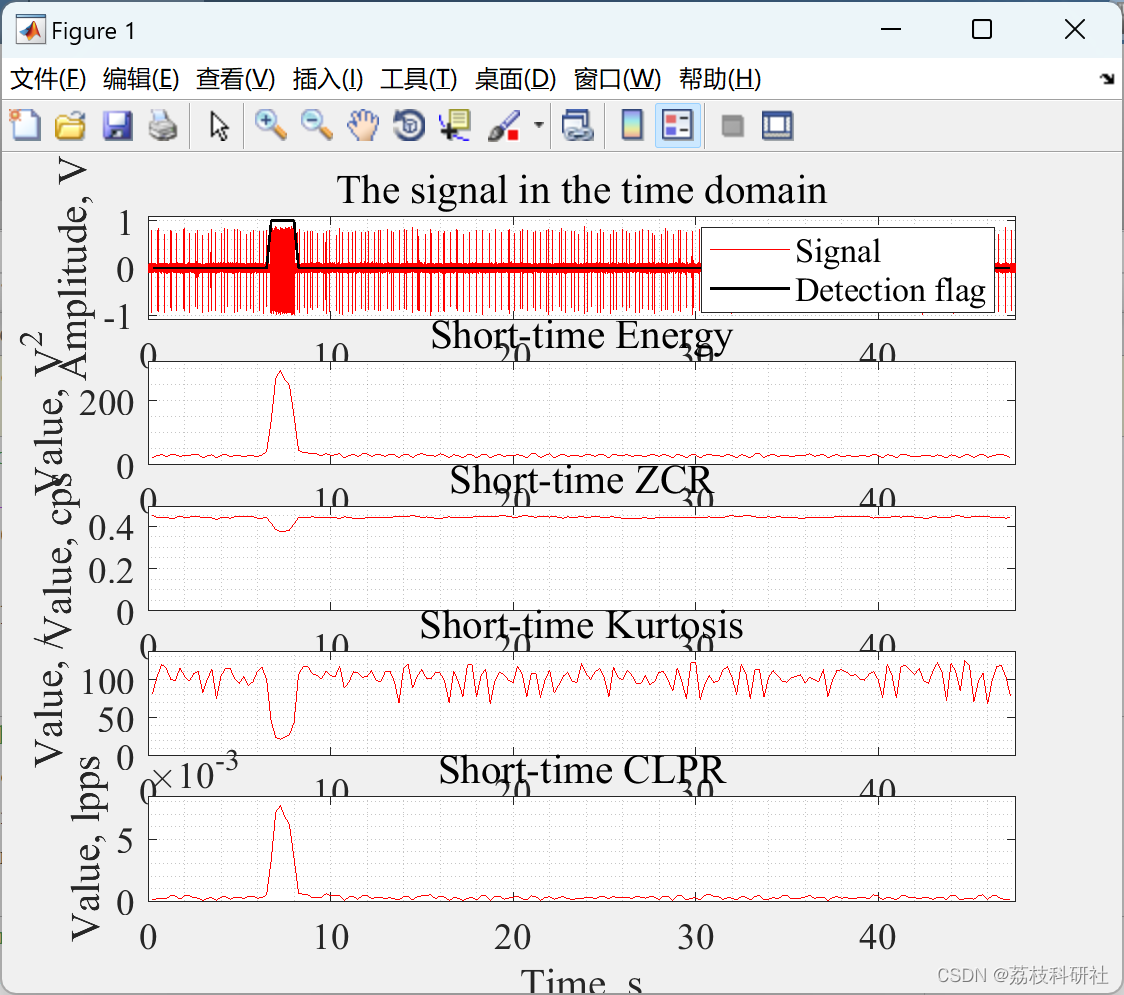
%% 最后一个运行结果图主函数
clear, clc, close all
%% load data file
load data_5.mat % load data
fs = 16000; % sampling frequency
x = x/max(abs(x)); % normalize the signal
N = length(x); % signal length
t = (0:N-1)/fs; % time vector%% signal framing
frlen = round(50e-3*fs); % frame length
hop = round(frlen/2); % hop size
[FRM, tfrm] = framing(x, frlen, hop, fs); % signal framing%% determine the Short-time Energy
STE = sum(abs(FRM).^2);%% determine the Short-time Zero-crossing Rate
STZCR = crossrate(FRM, 0);%% determine the Short-time Kurtosis
STK = kurtosis(FRM);%% determine the Short-time Conditional Local Peaks Rate
% minimum height difference between a peak and its neighbors
mindiff = 50e-3;% CLPR measurement
STCLPR = conlocpksrate(abs(FRM), mindiff);%% plot the results
% plot the signal waveform
figure(1)
subplot(5, 1, 1);
plot(t, x, 'r')
grid minor
hold on
xlim([0 max(t)])
ylim([-1.1*max(abs(x)) 1.1*max(abs(x))])
set(gca, 'FontName', 'Times New Roman', 'FontSize', 14)
xlabel('Time, s')
ylabel('Amplitude, V')
title('The signal in the time domain')% plot the STE
subplot(5, 1, 2)
plot(tfrm, STE, 'r')
grid minor
xlim([0 max(t)])
ylim([0 1.1*max(abs(STE))])
set(gca, 'FontName', 'Times New Roman', 'FontSize', 14)
xlabel('Time, s')
ylabel('Value, V^2')
title('Short-time Energy')% plot the STZCR
subplot(5, 1, 3)
plot(tfrm, STZCR, 'r')
grid minor
xlim([0 max(t)])
ylim([0 1.1*max(abs(STZCR))])
set(gca, 'FontName', 'Times New Roman', 'FontSize', 14)
xlabel('Time, s')
ylabel('Value, cps')
title('Short-time ZCR')% plot the STK
subplot(5, 1, 4)
plot(tfrm, STK, 'r')
grid minor
xlim([0 max(t)])
ylim([0 1.1*max(abs(STK))])
ylim([0 10])
set(gca, 'FontName', 'Times New Roman', 'FontSize', 14)
xlabel('Time, s')
ylabel('Value, /')
title('Short-time Kurtosis')% plot the STLPR
subplot(5, 1, 5)
plot(tfrm, STCLPR, 'r')
grid minor
xlim([0 max(t)])
ylim([0 1.1*max(STCLPR)])
set(gca, 'FontName', 'Times New Roman', 'FontSize', 14)
xlabel('Time, s')
ylabel('Value, lpps')
title('Short-time CLPR')%% mark the signal
DF = STCLPR > 1.5*mean(STCLPR);
subplot(5, 1, 1)
plot(tfrm, DF, 'k', 'LineWidth', 1)
legend('Signal', 'Detection flag', 'Location', 'SouthEast')
🎉3 参考文献
部分理论来源于网络,如有侵权请联系删除。
[1] H. Zhivomirov, N. Kostov. A Method for Signal Change Detection via Short-Time Conditional Local Peaks Rate Feature. Journal of Electrical and Electronics Engineering, ISSN: 1844-6035, Vol. 15, No. 2, Oct. 2022, pp. 106-109, 2022.


 489
489

 被折叠的 条评论
为什么被折叠?
被折叠的 条评论
为什么被折叠?
 到【灌水乐园】发言


