


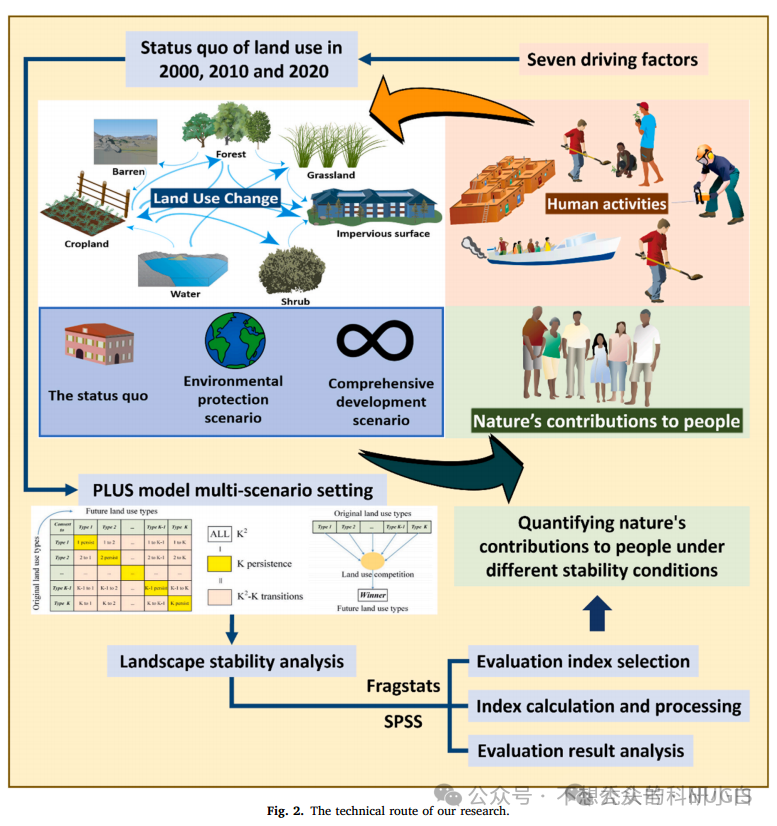
图1:The technical route of our research.
研究的技术路线
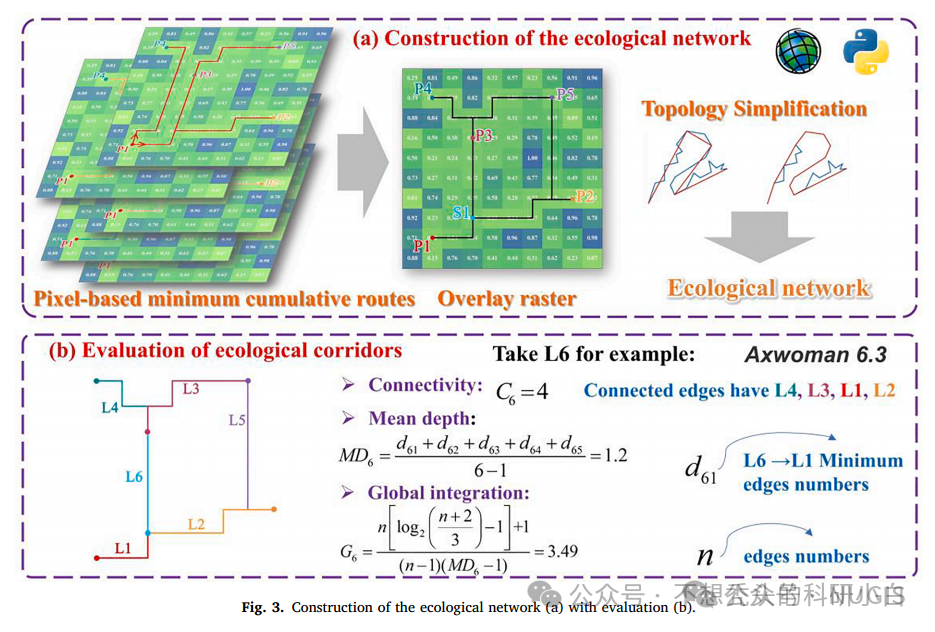
图2: Construction of the ecological network (a) with evaluation (b).
生态网络的建设(a)与评价(b)
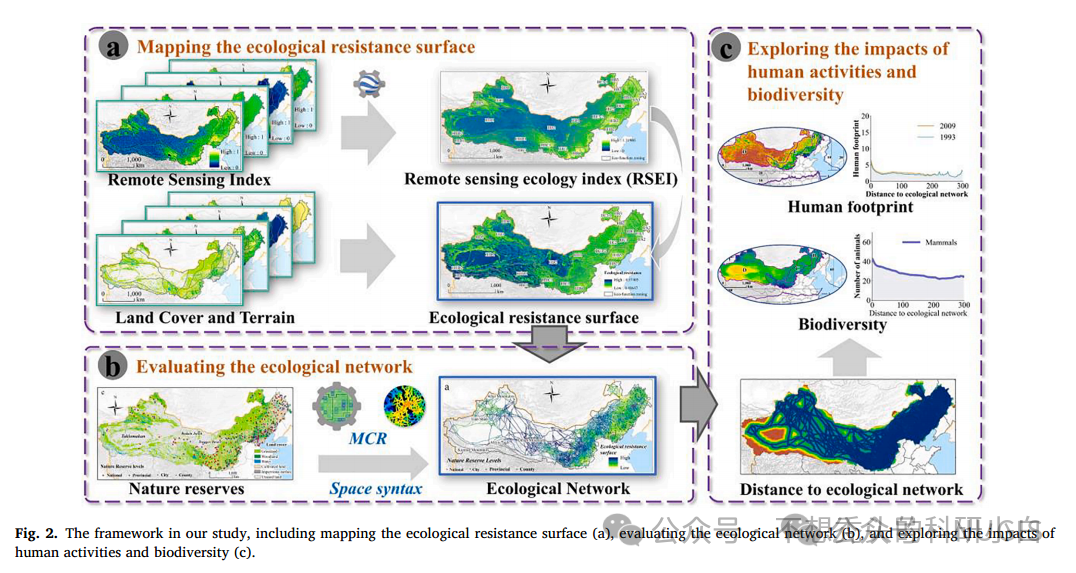
图3:The framework in study.
研究中的框架
注:包括绘制生态抗性表面(a),评估生态网络(b)以及探索人类活动和生物多样性的影响(c)
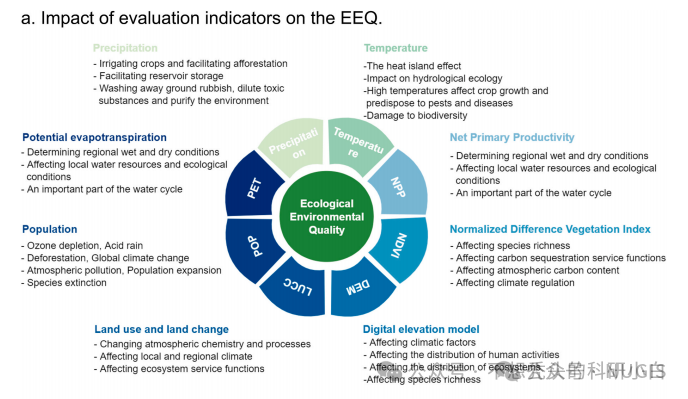
图4:lmpact of evaluation indicators on the EEQ.
EEQ评估指标的lmpact
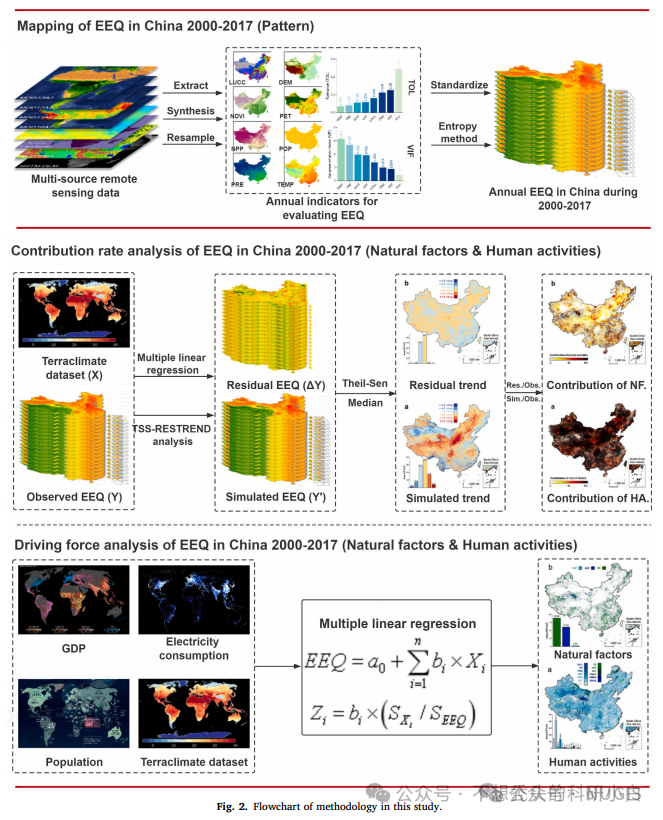
图5:Flowchart of methodology in this study.
本研究方法的流程图
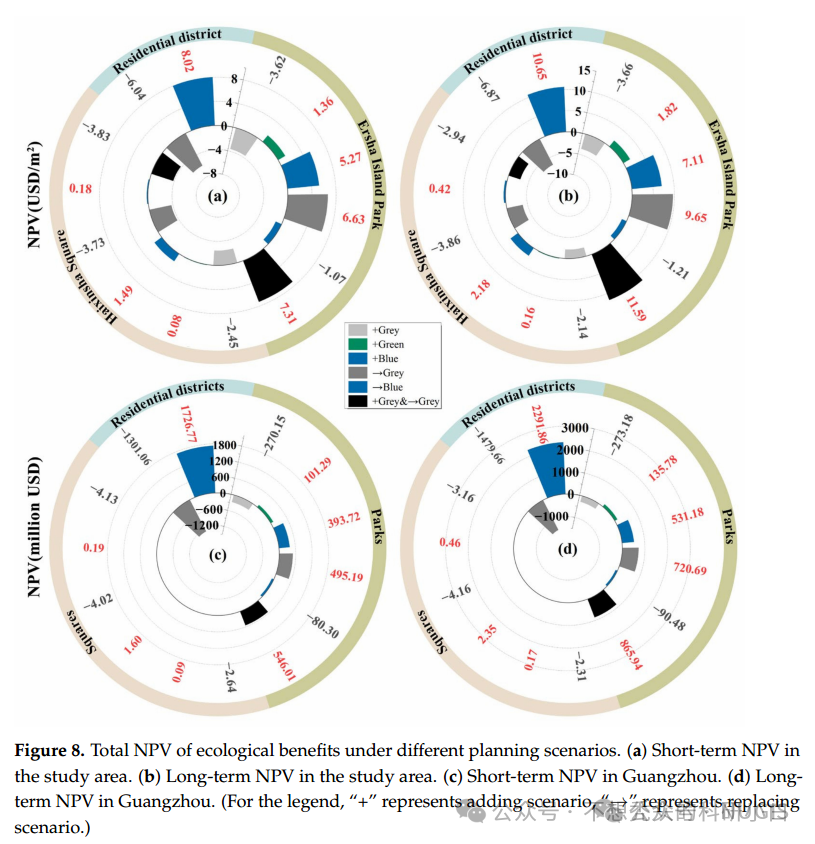
图6:Total NPV of ecological benefits under different planning scenarios.
不同规划情景下生态效益总净现值
注:(a) 研究区域的短期净现值。(b) 研究区的长期净现值。(c) 广州市短期净现值。(d) 广州市长期净现值。(对于图例,“+”表示添加方案,“→”表示替换方案。

图7:Methodology workflow.
方法工作流
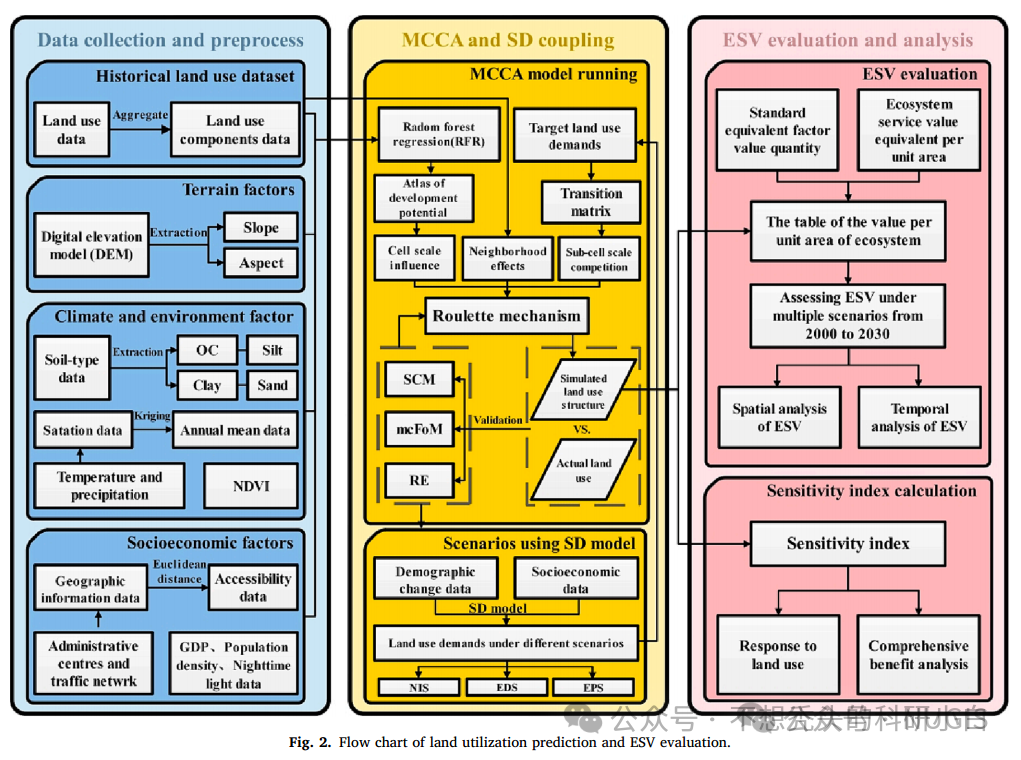
图8:Flow chart of land utilization prediction and ESV evaluation.
土地利用预测和ESV评估流程图
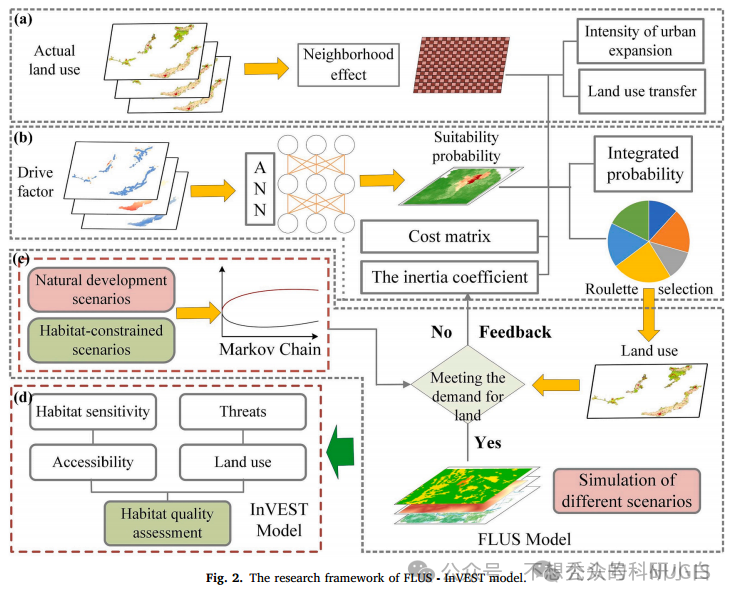
图9:The research framework of FLUS .InVEST model.
FLUS的研究框架。InVEST模型
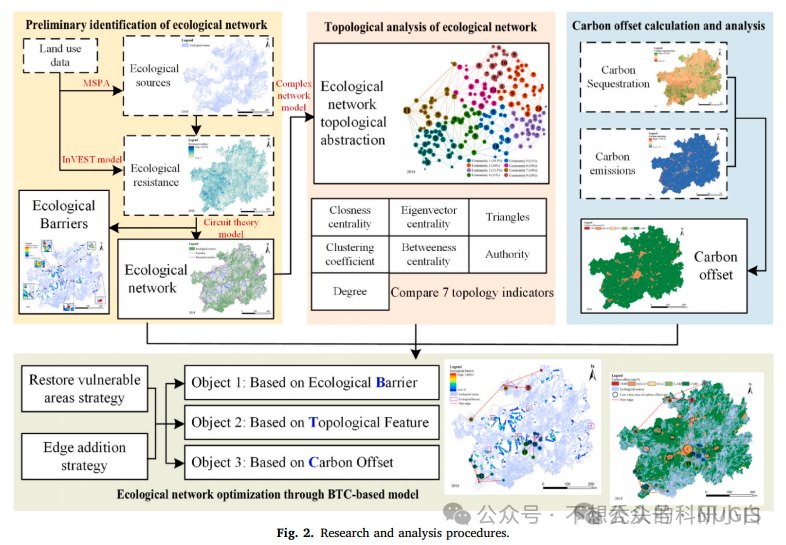
图10:Research and analysis procedures.
研究和分析程序
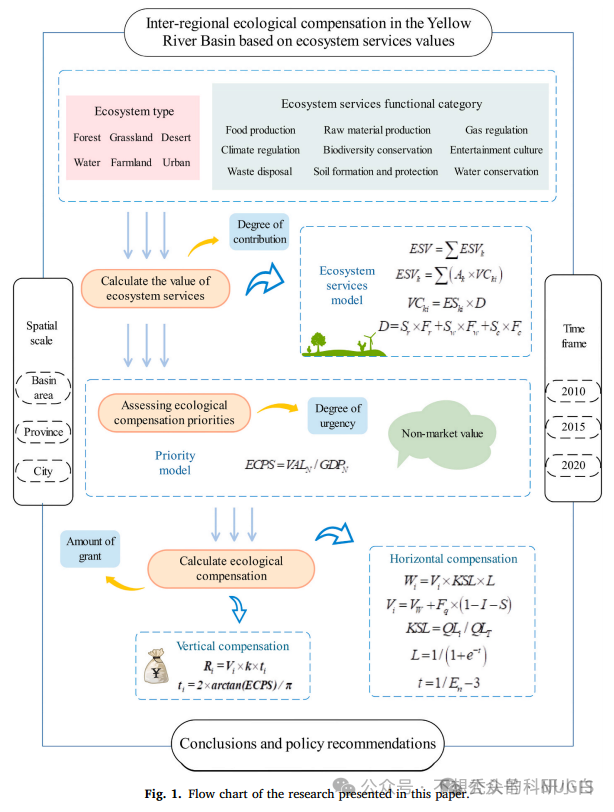
图11:Flow chart of the research presented in this paper.
本文介绍的研究流程图
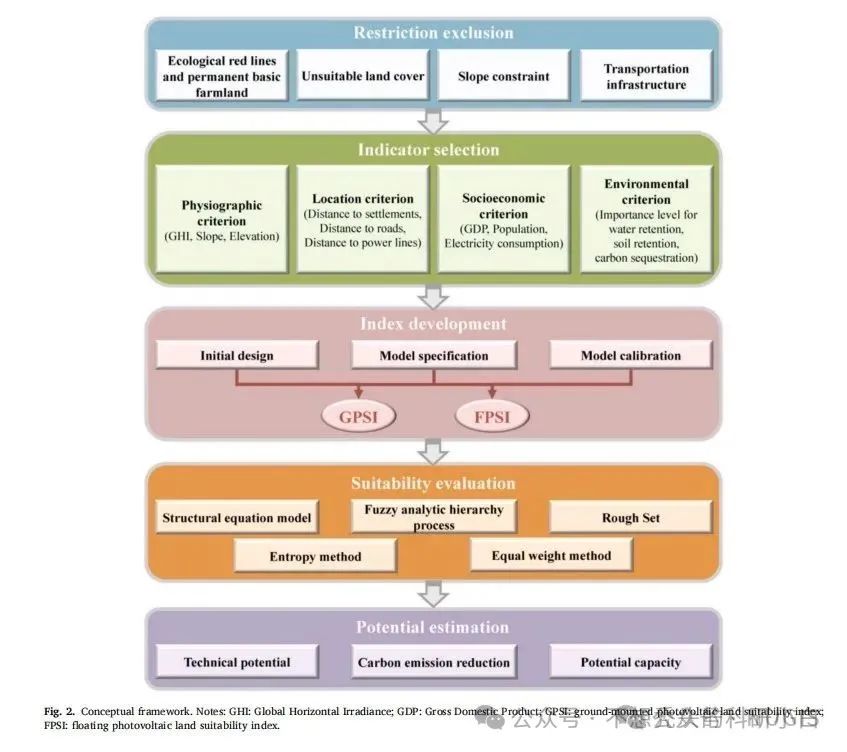
图12:Conceptual framework.
概念框架
注:GHI:全球水平辐照度;国内生产总值:国内生产总值;GPSI:地面安装光栅土地适宜性指数;FPSI:浮动光伏土地适宜性指数。
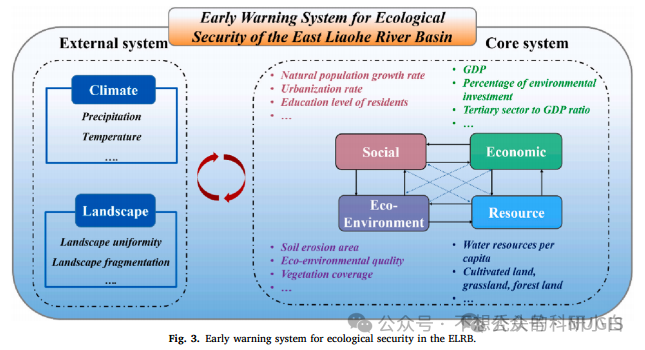
图13:Early warning system for ecological security in the ELRB.
ELRB生态安全预警系统
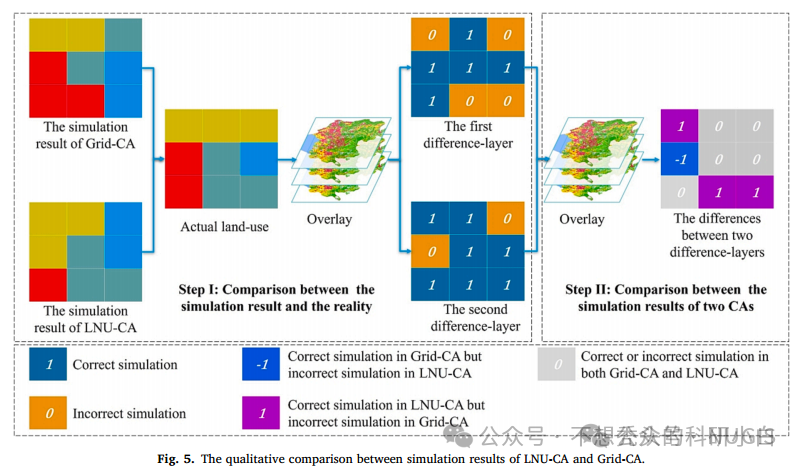
图14:The qualitative comparison between simulation results of LNU-CA and Grid-CA.
LNU-CA和Grid-CA仿真结果的定性比较
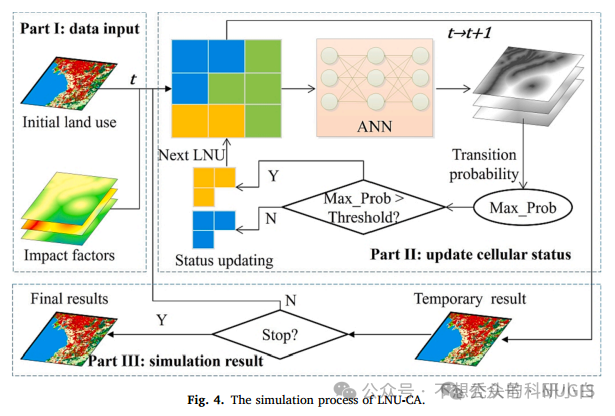
图15:The simulation process of LNU-CA.
LNU-CA的仿真过程
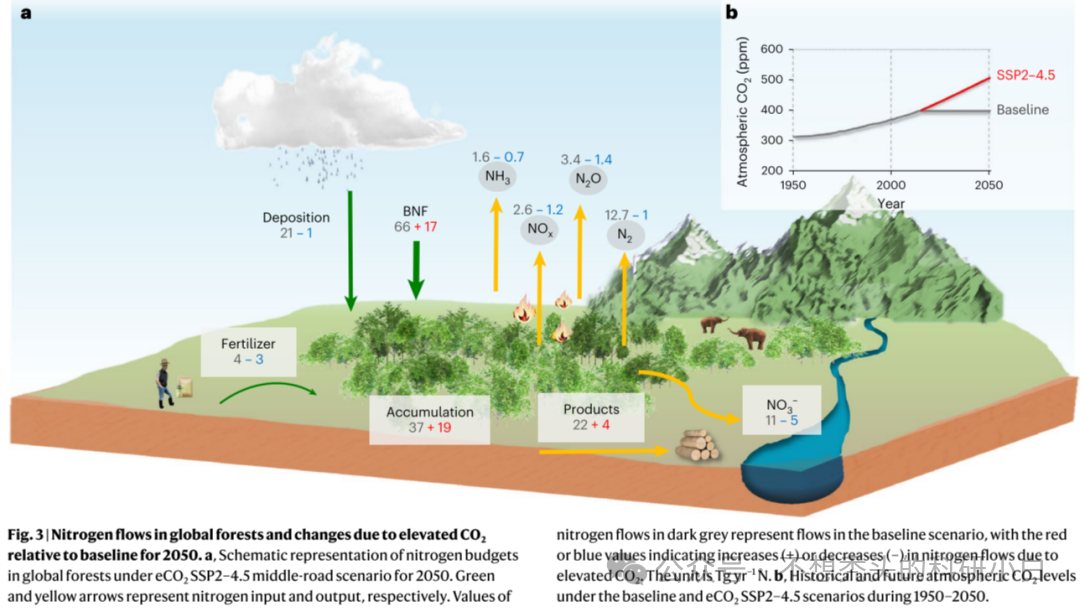
图1:Nitrogen flows in global forests and changes due to elevated CO2 relative to baseline for 2050.
2050年全球森林氮素流动和CO2浓度相对于基线升高导致的变化
注:a, 2050年eCO2SSP2-4.5中间道路情景下全球森林氮收支示意图,绿色和黄色箭头分别表示氮输入和输出。b,1950-2050年基线和eCO情景下的历史和未来大气CO水平,SSP2-4.5情景。
原文链接:
https://doi.org/10.1038/s41558-024-01973-9
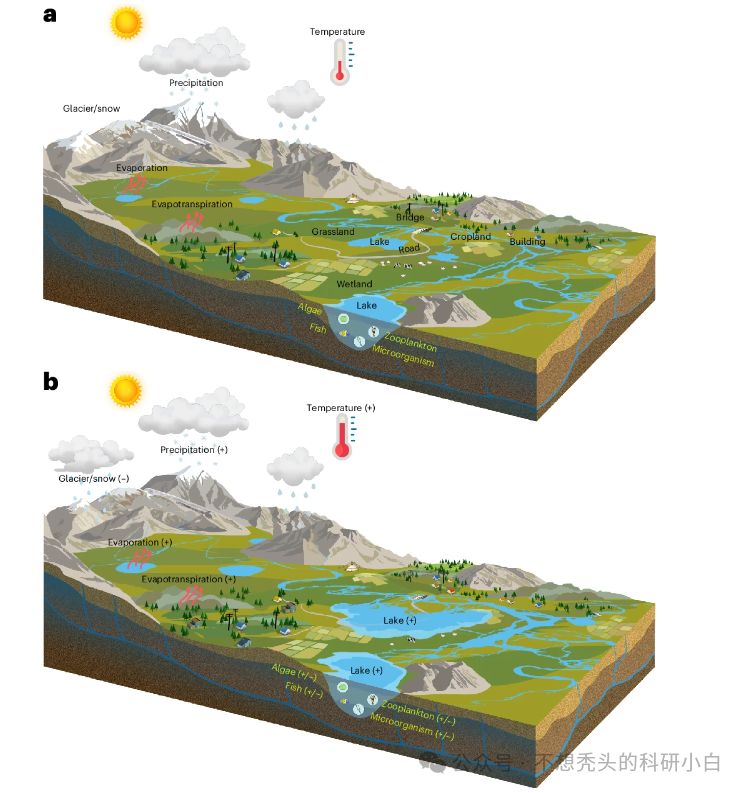
图2: Schematic diagram of the future development of lakes and their impact on the ecology of the Tibetan Plateau.
未来湖泊发展及其对青藏高原生态影响的示意图
原文链接:
https://www.nature.com/articles/s41561-024-01447-9#/

图3:Possible response mechanism of permafrost to precipitation increase over the Tibetan Plateau.
青藏高原多年冻土对降水增加的可能响应机理
原文链接:
http://kns.cnki.net/kcms/detail/11.5842.P.20240408.2119.002.html
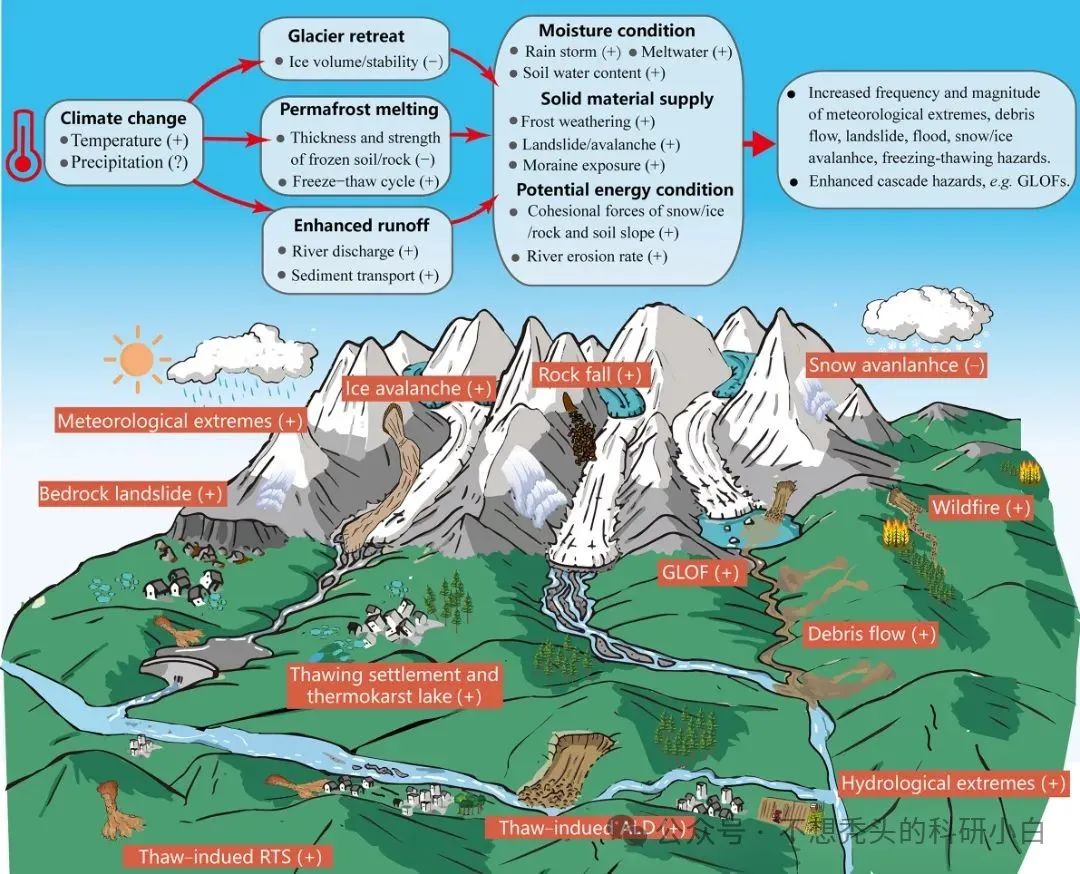
图4:Schematic diagram of the disaster effects of climate change.
气候变化灾害效应示意图
原文链接:
https://doi.org/10.1016/j.accre.2024.06.003

图5:Highland natural disasters versus remote effects of lowlands.
高地自然灾害与低地的远程影响
原文链接:
https://doi.org/10.1016/j.accre.2024.06.003

图6:Schematic diagram of the water cycle.
水循环示意图
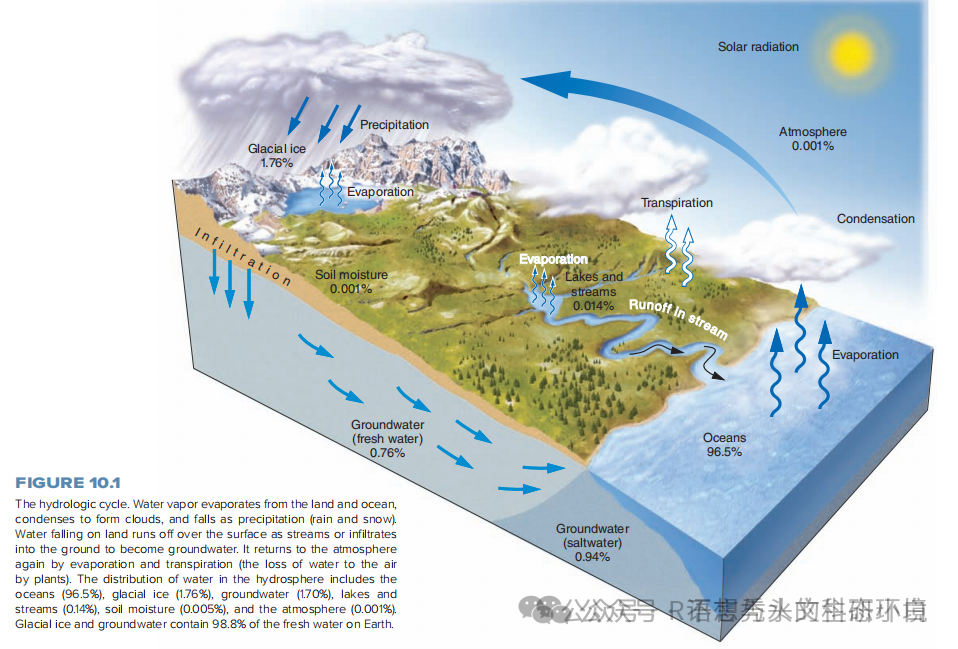
图7:Hydrological cycle.
水文循环

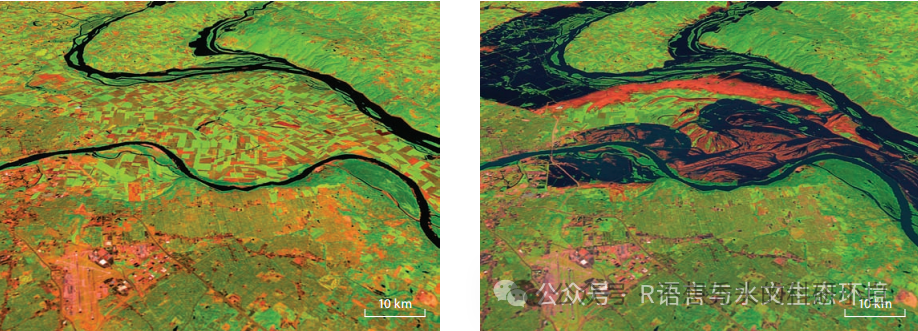
图8:The process of forming floodplains during flood periods.
洪水期形成泛滥平原过程
注:(A)密苏里河(下)、密西西比河(左上)和伊利诺斯河(右上)的洪水前图像(1991年8月14日)。植被用绿色表示,红色表示最近开垦的农田(裸露的土壤)。(B)的照片拍摄于1993年大洪水后的11月7日,显示了河流如何从河岸蔓延到平坦的洪泛平原。

图9:Drainage patterns can reveal the rocks underneath.
排水模式可以揭示出下面的岩石
注:(A)树突状图案发育在均匀可侵蚀的岩石上。(B)在圆锥形的山或圆顶上形成放射状图案。(C)在定期断裂的岩石上形成一个矩形图案。(D)由于抗阻力和非阻力倾斜岩层的侵蚀,在交替的山脊和山谷上形成格子状。

图10:The area of maximum velocity in the river.
河流中最大速度的区域
注:地图上的箭头显示了最大速度如何移动到曲线的外部。切片显示了曲线外和河道中心的最大速度。

图11:Changes in the width of the river channel caused by rock types and obstacles.
由岩石类型和障碍物引起的河道宽度变化
注:箭头的长度表示速度。(A)软岩石的河道可能变宽。可能随着流速下降而导致沉积。(B)山体滑坡可能会缩小河道,增加水流速度。由此产生的侵蚀通常会清除滑坡碎片。(C)桥墩(或其他障碍物)会增加速度,有时还会侵蚀旁边的桥墩

图12:Hydraulic action releases, rolls and lifts the pellets.
液压作用可以松开、滚动和提升颗粒
来源:NUGIS、不想秃头的科研小白、R语言与水文生态环境等


 370
370

 被折叠的 条评论
为什么被折叠?
被折叠的 条评论
为什么被折叠?
 到【灌水乐园】发言


