


#导入库
import numpy as np
import matplotlib.pyplot as plt
#数据输入
x = np.arange(0,8)
y1 = [20,15,2,14,8,22,5,9]
y2 = [1,5,3,8,11,2,21,5]
#设置折线的名称,颜色
plt.plot(x, y1, label="y1", color='red')
plt.plot(x, y2, label="y2", color='yellow')
#设定坐标轴
plt.xlabel("X")
plt.ylabel("Y")
#设置图像名
plt.title("ABC")
#输出图像
plt.show()
结果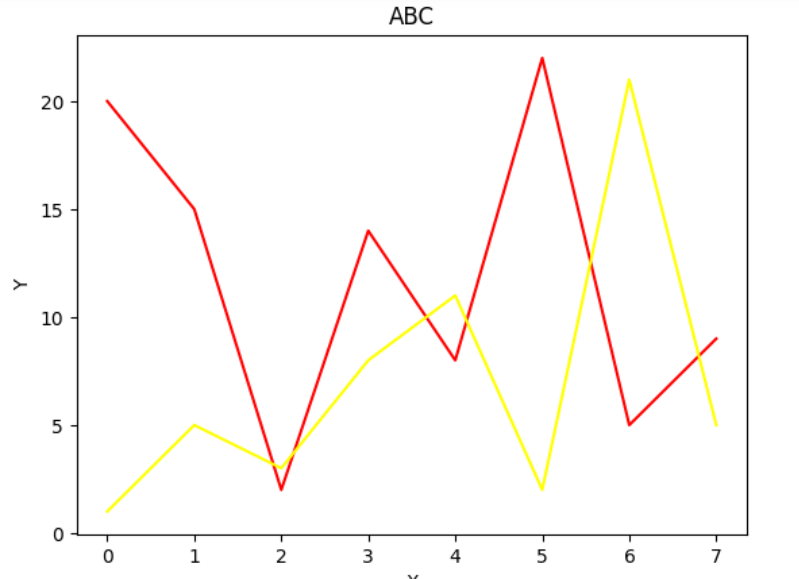


 455
455

 被折叠的 条评论
为什么被折叠?
被折叠的 条评论
为什么被折叠?
 到【灌水乐园】发言


