


一、基本分析目标
(1)计算中国男篮、女篮运动员的平均身高与平均体重;
(2)分析中国篮球运动员的年龄分布;
(3)计算中国篮球运动员的体质指数。
二、分析其他目标
(1)分析美国运动员相关信息,与中国远动员信息作比较,得出一定结论;
(2)中国各个省份参加足球的基本信息分析;
(3)分析各国参赛情况;
(4)将得出的信息进行数据可视化,更加直观地展示。
三、代码+结论展示
(1)导入数据
import numpy as np
import pandas as pd
file_one = pd.read_excel('运动员信息采集01.xlsx')
file_two = pd.read_excel('运动员信息采集02.xlsx')
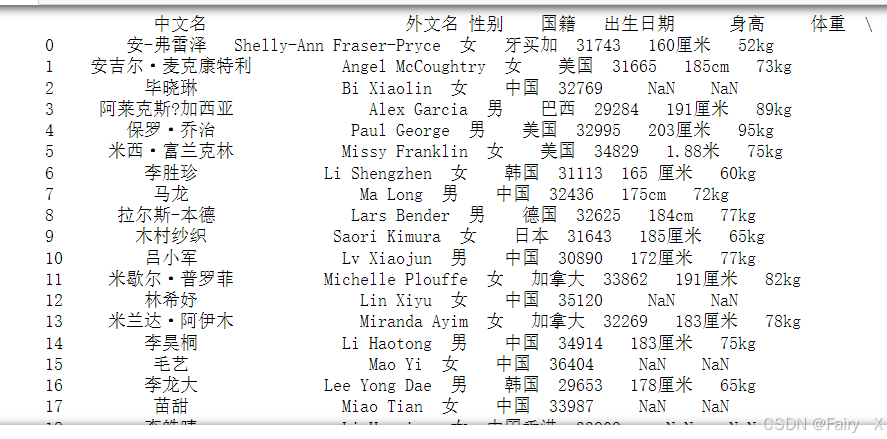
print(file_one)
print(file_two)运行结果如下:
(2)分别读取两个数据,展示为表格形式
file_onefile_two(3)合并两个文件数据(利用“outer”进行外连接合并)
all_data = pd.merge(left=file_one,right=file_two,how='outer')
all_data
分析中国情况
(4)提取中国运动员信息
all_data = all_data[all_data['国籍'] == '中国']
all_data
(5)去除重复值
all_data = all_data.drop_duplicates()
all_data = all_data.reset_index(drop=True)
all_data
(6)去重后绘制中国参加所有项目的柱状图
import matplotlib.pyplot as plt
from collections import Counter
projects = [str(project) for project in all_data['项目']]
participation = Counter(projects)
labels = participation.keys()
sizes = participation.values()
plt.figure(figsize=(40,20))
bars = plt.bar(labels, sizes, color='pink')
plt.xticks(x=labels,rotation=60)
plt.xlabel('项目')
plt.ylabel('参与人数')
plt.title('中国参加的所有项目')
for bar in bars:
    height = bar.get_height()
    plt.text(bar.get_x() + bar.get_width()/2, height, '%d' % int(height), ha='center', va='bottom')
plt.show()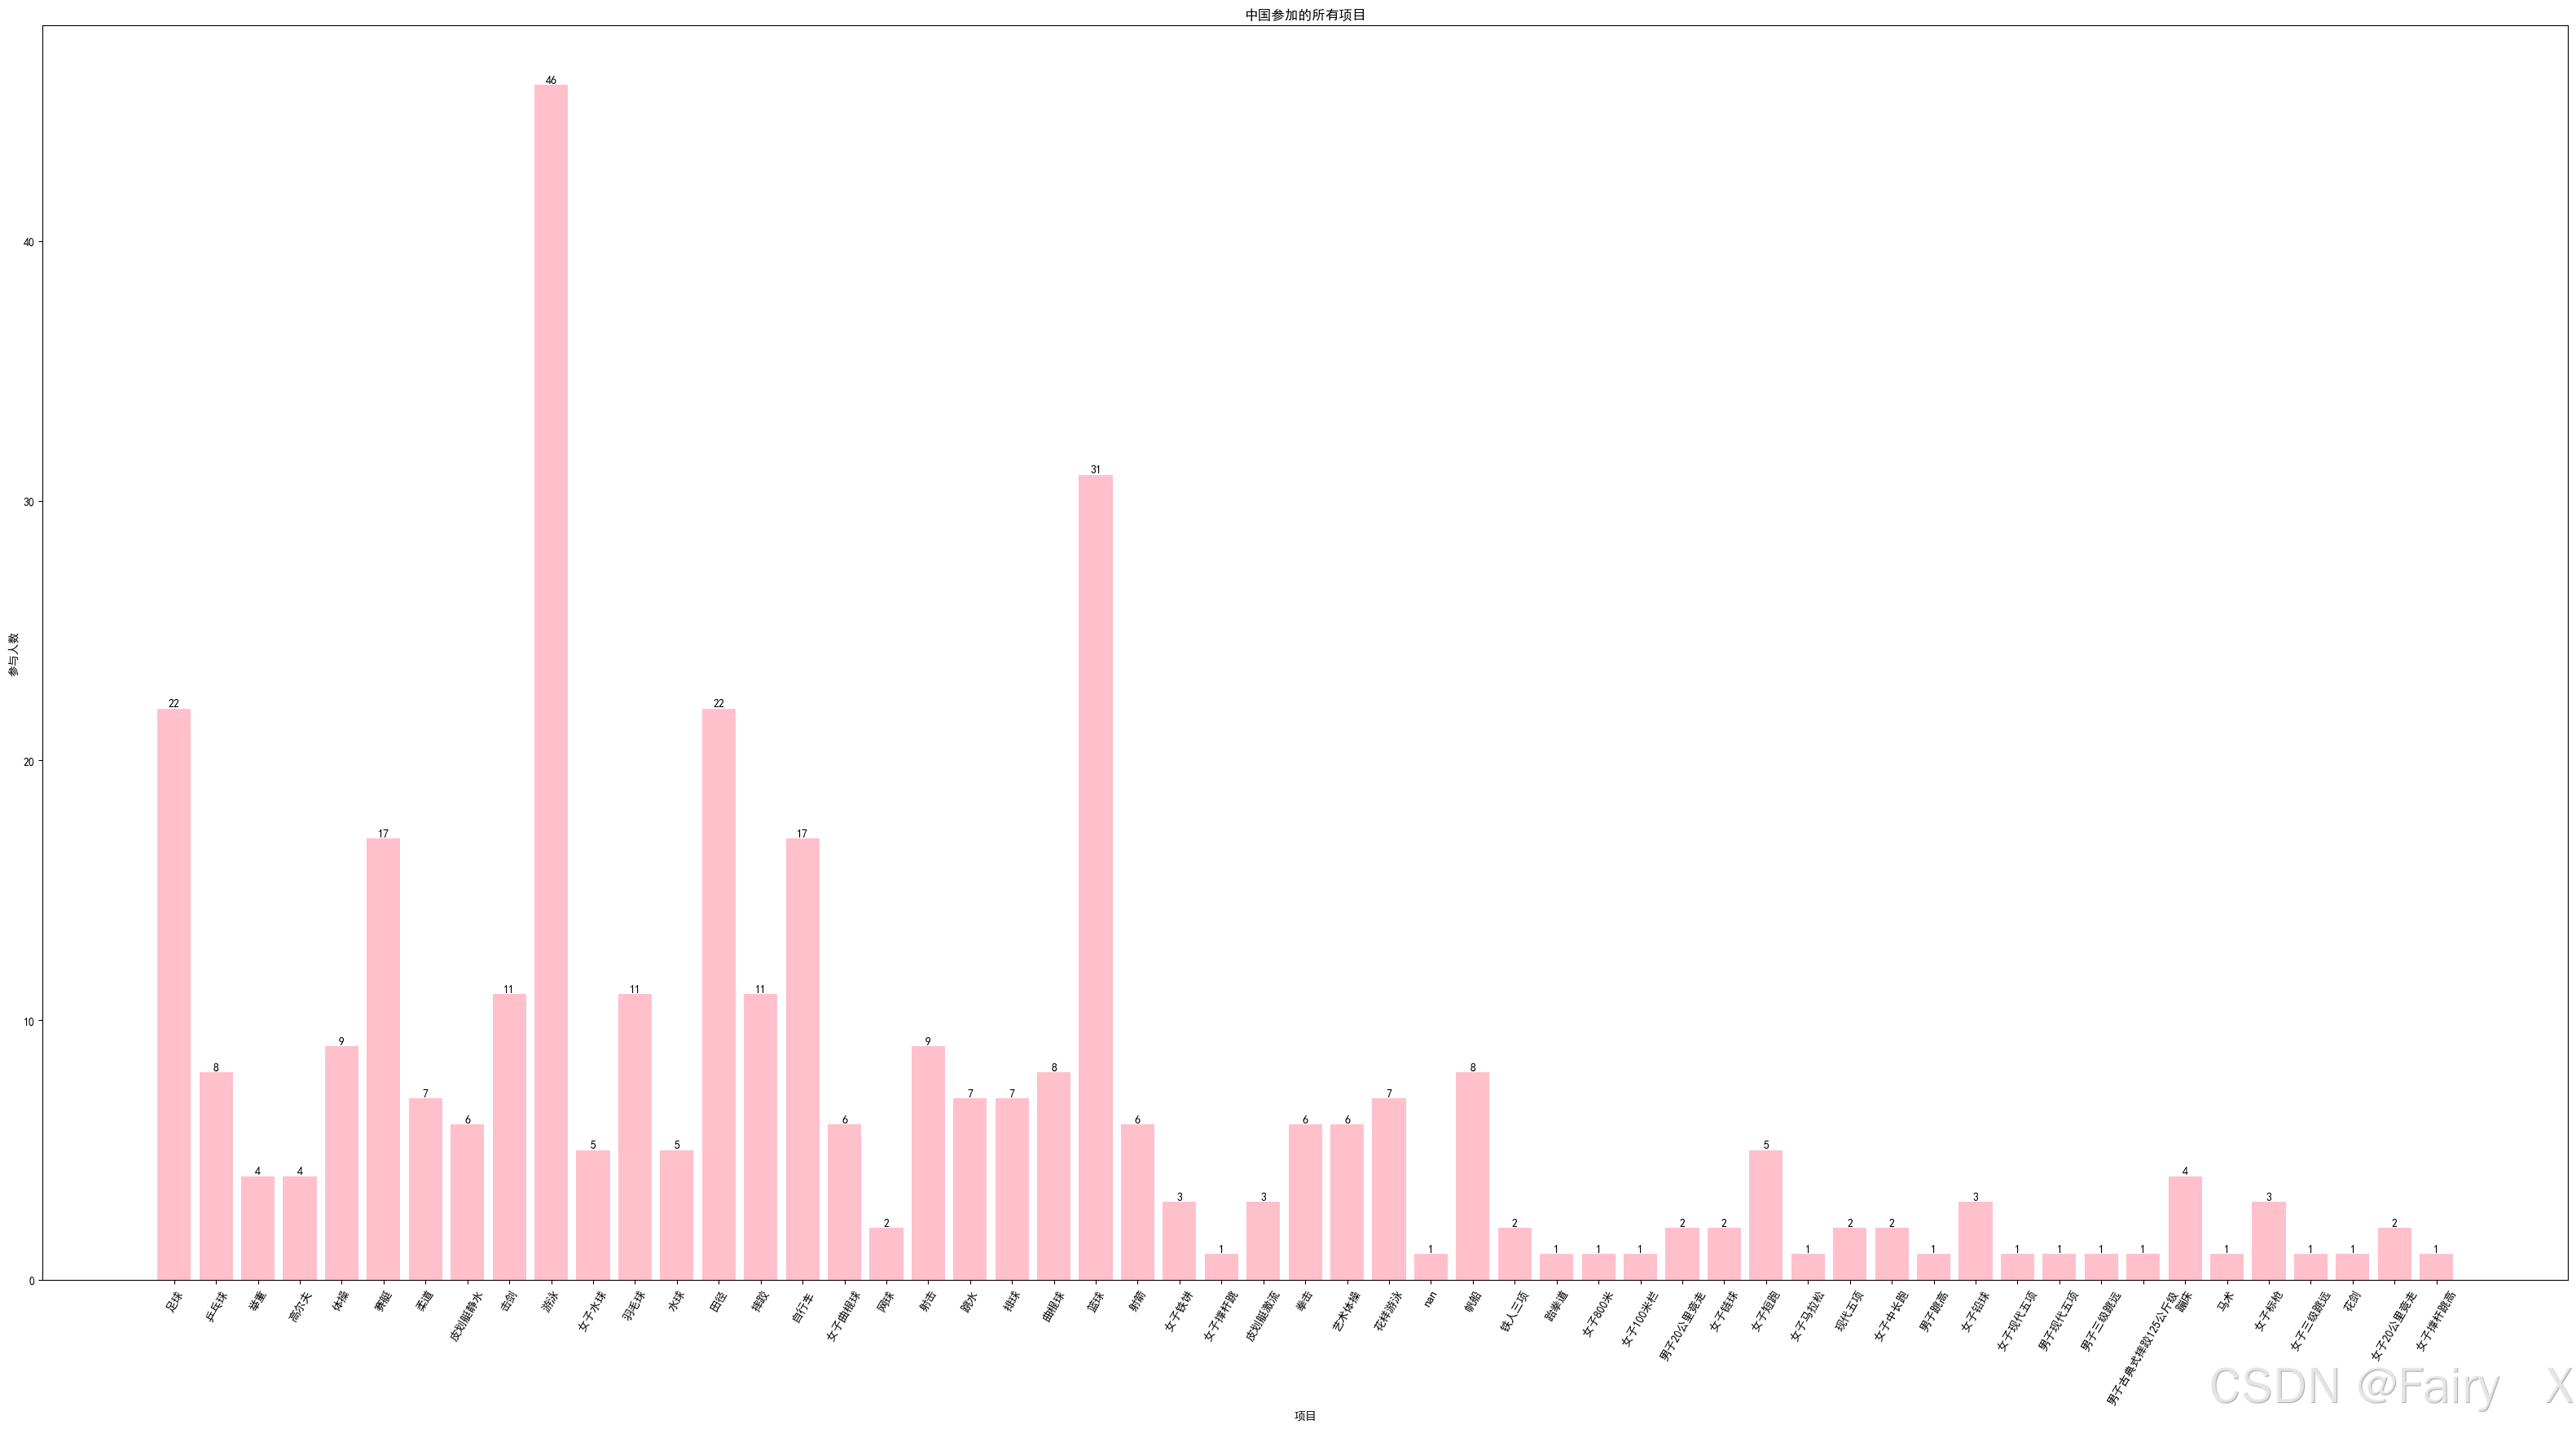
得出结论:中国参加游泳项目的人数最多为46人,从柱状图来看,能够观察出中国在各个项目中都有运动员参与,说明中国注重体育方面的发展。
处理缺失值:
(7)提取中国篮球运动员信息(共有31名)
basketball_data = all_data[all_data['项目'] == '篮球']
basketball_data
(8)将中国篮球运动员出生日期统一为年月日
import datetime
basketball_data = basketball_data.copy()
initial_time = datetime.datetime.strptime('1900-01-01',"%Y-%m-%d")
for i in basketball_data.loc[:,'出生日期']:
    if type(i) == int:
        new_time = (initial_time + datetime.timedelta(days=i)).strftime('%Y{y}%m{m}%d{d}').format(y='年',m='月',d='日')
        basketball_data.loc[:,'出生日期'] = basketball_data.loc[:,'出生日期'].replace(i,new_time)
basketball_data
(9)仅查看年份
basketball_data.loc[:,'出生日期'] = basketball_data['出生日期'].apply(lambda x:x[:5])
basketball_data['出生日期']
(10)将中国男篮身高统一形式为cm(男篮人数:11人)
male_data = basketball_data[basketball_data['性别'].apply(lambda x :x == '男')]
male_data = male_data.copy()
male_height = male_data['身高'].dropna()
fill_male_height = round(male_height.apply(lambda x : x[0:-2]).astype(int).mean())
fill_male_height = str(int(fill_male_height)) + '厘米'
male_data.loc[:,'身高'] = male_data.loc[:,'身高'].fillna(fill_male_height )
male_data.loc[:,'身高'] = male_data.loc[:,'身高'].apply(lambda x: x[0:-2]).astype(int)
male_data.rename(columns={'身高':'身高/cm'},inplace=True)
male_data
(11)将中国男篮身高绘制成柱状图
import matplotlib.pyplot as plt
plt.rcParams['font.sans-serif'] = ['SimHei']
fig = plt.figure(figsize=(8,4))
bars = plt.bar(male_data['中文名'],male_data['身高/cm'],width=0.8)
for bar in bars:
    height = bar.get_height()
    plt.text(bar.get_x() + bar.get_width()/2, height, height, ha='center', va='bottom')
plt.show()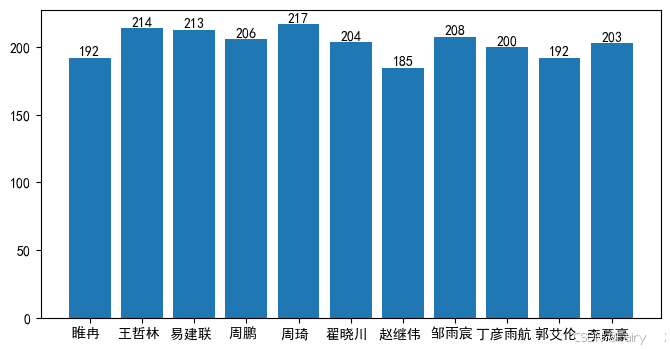
(12)将中国女篮身高统一形式为cm(女篮人数:20人)
female_data = basketball_data[basketball_data['性别'].apply(lambda x :x == '女')]
female_data = female_data.copy()
data = {'191cm':'191厘米','1米89公分':'189厘米','2.01米':'201厘米','187公分':'187厘米','1.97M':'197厘米','1.98米':'198厘米','192cm':'192厘米'}
female_data.loc[:,'身高'] = female_data.loc[:,'身高'].replace(data)
female_height = female_data['身高'].dropna()
fill_female_height = round(female_height.apply(lambda x : x[0:-2]).astype(int).mean())
fill_female_height = str(int(fill_female_height)) + '厘米'
female_data.loc[:,'身高'] = female_data.loc[:,'身高'].fillna(fill_female_height)
female_data['身高'] = female_data['身高'].apply(lambda x: x[0:-2]).astype(int)
female_data.rename(columns={'身高':'身高/cm'},inplace=True)
female_data
(13)处理女篮体重:将88千克改为88kg;将8kg进行向上填充为77kg;处理缺失值将所有NaN改为体重均值80kg,统一的体重单位为kg
female_data.loc[:,'体重'] = female_data.loc[:,'体重'].replace({'88千克':'88kg'})
female_data
female_data['体重'].replace(to_replace = '8kg',method = 'pad',inplace = True)
female_datafemale_weight = female_data['体重'].dropna()
female_weight = female_weight.apply(lambda x :x[0:-2]).astype(int)
fill_female_weight = round(female_weight.mean())
fill_female_weight = str(int(fill_female_weight)) + 'kg'
female_data.loc[:,'体重'].fillna(fill_female_weight,inplace = True)
female_data(14)合并中国男篮、女篮信息,转换为int类型并将体重改为体重/kg
basketball_data = pd.concat([male_data,female_data])
basketball_data['体重'] = basketball_data['体重'].apply(lambda x : x[0:-2]).astype(int)
basketball_data.rename(columns = {'体重':'体重/kg'},inplace = True)
basketball_data
(15)检测男篮、女篮、所有篮球运动员身高异常值
from matplotlib import pyplot as plt
plt.rcParams['font.sans-serif'] = ['SimHei']
male_data.boxplot(column = ['身高/cm'])
plt.show()
female_data.boxplot(column=['身高/cm'])
plt.show()basketball_data.boxplot(column=['身高/cm'])
plt.show()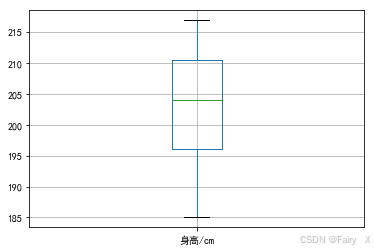
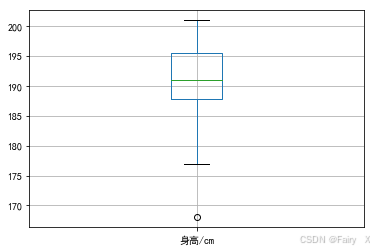
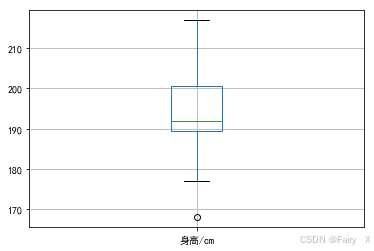
(16)根据3准则检测到有一个异常值,但根据调查该数据属实,所以不属于异常值,可忽略不计
def three_sigma(ser):
    mean_data = ser.mean()
    std_data = ser.std()
    rule = (mean_data - 3*std_data > ser) | (mean_data + 3*std_data < ser)
    index = np.arange(ser.shape[0])[rule]
    outliers = ser.iloc[index]
    return outliers
female_weight = basketball_data[basketball_data['性别'] == '女']
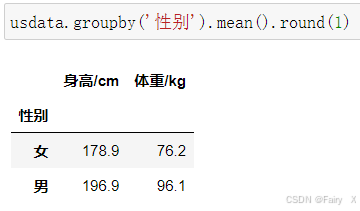
three_sigma(female_weight['体重/kg'])(17)计算中国篮球远动员的身高、体重的平均值
basketball_data.groupby('性别').mean().round(1)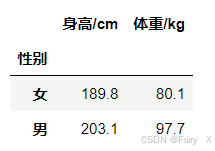
(18)绘制中国篮球运动员年龄分布的直方图
import matplotlib.pyplot as plt
plt.rcParams['font.sans-serif'] = ['SimHei']
ages = 2020 - basketball_data['出生日期'].apply(lambda x :x[0:-1]).astype(int)
ax = ages.plot(kind = 'hist')
ax.set_xlabel('年龄(岁)')
ax.set_ylabel('频数')
ax.set_title('篮球运动员年龄分布的直方图')
ax.set_xticks(range(ages.min(),ages.max()+1,2))
plt.show()
(19)添加体质指数
basketball_data['体质指数'] = 0
basketball_data
def outer(num):
def ath_bmi(sum_bmi):
weight = basketball_data['体重/kg']
height = basketball_data['身高/cm']
sum_bmi = weight / (height/100)**2
return num + sum_bmi
return ath_bmibasketball_data['体质指数'] = basketball_data[['体质指数']].apply(outer(basketball_data['体质指数'])).round(1)
basketball_data(20)查找中国男篮、女篮非正常体质指数的人数
groupby_obj = basketball_data.groupby(by="性别")
females = dict([x for x in groupby_obj])['女']['体质指数'].values
count = females[females < 19].size + females[females > 24].size
print(f'体质指数小于19:{females[females < 19]}')
print(f'体质指数大于24:{females[females > 24]}')
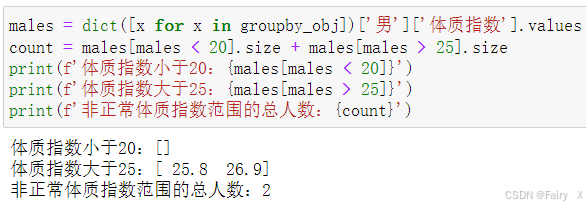
print(f'非正常体质指数范围的总人数:{count}')males = dict([x for x in groupby_obj])['男']['体质指数'].values
count = males[males < 20].size + males[males > 25].size
print(f'体质指数小于20:{males[males < 20]}')
print(f'体质指数大于25:{males[males > 25]}')
print(f'非正常体质指数范围的总人数:{count}')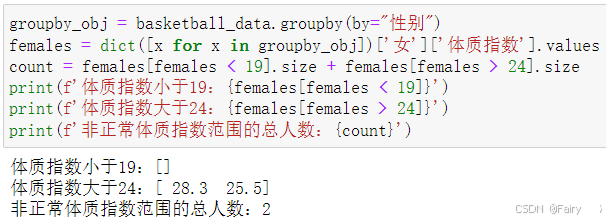
(21)处理中国篮球运动员省份的缺失值,查找并删除(最后剩余30人,仅删除1个省份缺失值)
basketball_data['省份'].isnull()data = basketball_data.dropna()
data(22)进行数据可视化:绘制省份与篮球运动身高的散点图、运动员体重的柱状图、中国篮球运动员体重和身高之间的关系
plt.rcParams['font.sans-serif'] = ['SimHei']
fig = plt.figure(figsize=(20,15))
plt.scatter(data['省份'],data['身高/cm'],color='r',linestyle='-')
plt.grid(True,linestyle='-',alpha=0.9)
plt.legend(loc=0)
plt.xlabel("运动员生源地")
plt.ylabel("身高/cm")
plt.title("省份与篮球运动员身高的关系")
plt.show()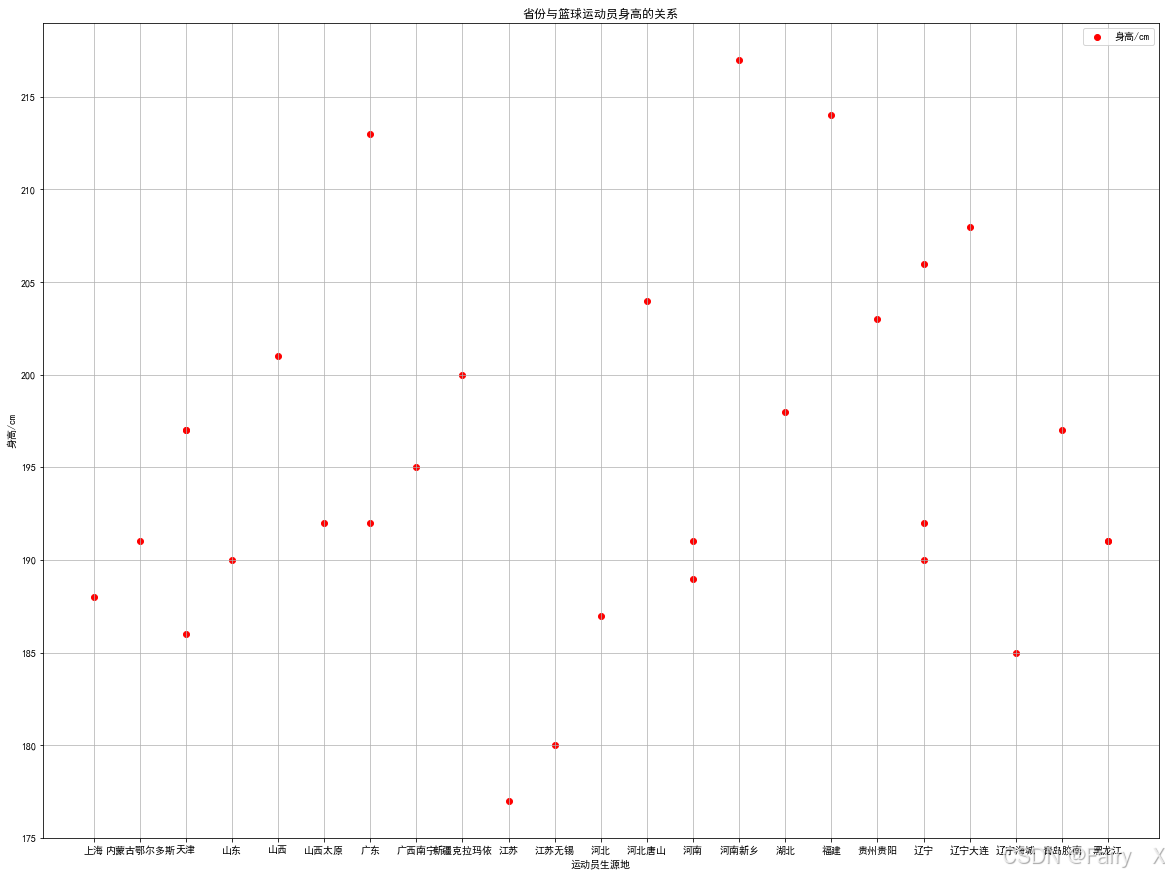
得出结论:河南新乡省的篮球运动员身高较高为215cm以上;其次为福建省、广东省,其中两省的身高都在210cm以上,福建省要比广东省的身高较高一点;江苏省的运动员身高较其他省份的低一点,为175cm左右。
import seaborn as sns
import matplotlib.pyplot as plt
plt.rcParams['font.sans-serif'] = ['SimHei']
fig = plt.figure(figsize=(15,10))
sns.barplot(x = data['中文名'],y = data['体重/kg'])
for x,y in enumerate(data['体重/kg']):
    plt.text(x,y,"%s"%round(y,1))
plt.ylabel('体重/kg')
plt.xlabel('中文名')
plt.title('篮球运动员的体重')
plt.show()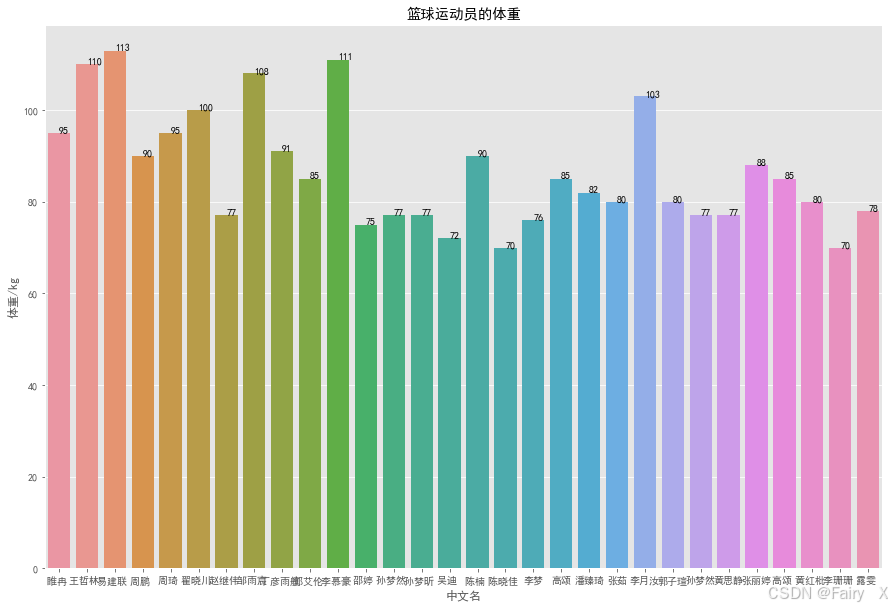
得出结论:易建联的体重较高为113kg;最低体重为70kg(分别为陈晓佳和李珊珊)
import matplotlib.pyplot as plt
height = basketball_data['身高/cm']
weight = basketball_data['体重/kg']
plt.figure(figsize=(10, 6))
plt.scatter(height, weight, color='r')
plt.xlabel('身高 (cm)')
plt.ylabel('体重 (kg)')
plt.title('体重和身高之间的关系')
plt.show()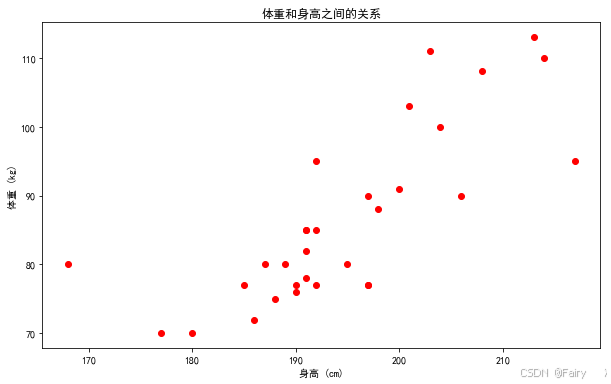
得出结论:身高190cm左右,体重为75kg左右的运动员分布较为密集。
分析美国情况
(23)索引美国运动员信息(需要重新运行合并的两个数据表代码)
import numpy as np
import pandas as pd

file_one = pd.read_excel('运动员信息采集01.xlsx')
file_two = pd.read_excel('运动员信息采集02.xlsx')
print(file_one)
print(file_two)

file_one

file_two

all_data = pd.merge(left=file_one,right=file_two,how='outer')
all_data
usdata= all_data[all_data['国籍'] == '美国']
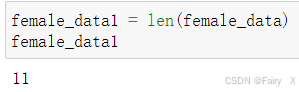
usdatausdata1 = len(usdata)
usdata1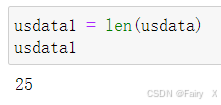 (共有25名美国运动员)
(24)统一美国运动员出生日期
import datetime
usdata = usdata.copy()
initial_time = datetime.datetime.strptime('1900-01-01',"%Y-%m-%d")
for i in usdata.loc[:,'出生日期']:
    if type(i) == int:
        new_time = (initial_time + datetime.timedelta(days=i)).strftime('%Y{y}%m{m}%d{d}').format(y='年',m='月',d='日')
        usdata.loc[:,'出生日期'] = usdata.loc[:,'出生日期'].replace(i,new_time)
usdata
(25)绘制美国参加项目的柱状图、项目占比的饼状图
import matplotlib.pyplot as plt
from collections import Counter
plt.rcParams['font.sans-serif'] = ['SimHei']
projects = usdata['项目']
participation =  Counter(usdata['项目'])
labels = participation .keys()
sizes = participation .values()
plt.figure(figsize=(10,6))
bars = plt.bar(labels, sizes, color='r')
plt.xlabel('项目')
plt.ylabel('参与人数')
plt.title('美国参加的所有项目')
for bar in bars:
    height = bar.get_height()
    plt.text(bar.get_x() + bar.get_width()/2, height, height, ha='center', va='bottom')
plt.show()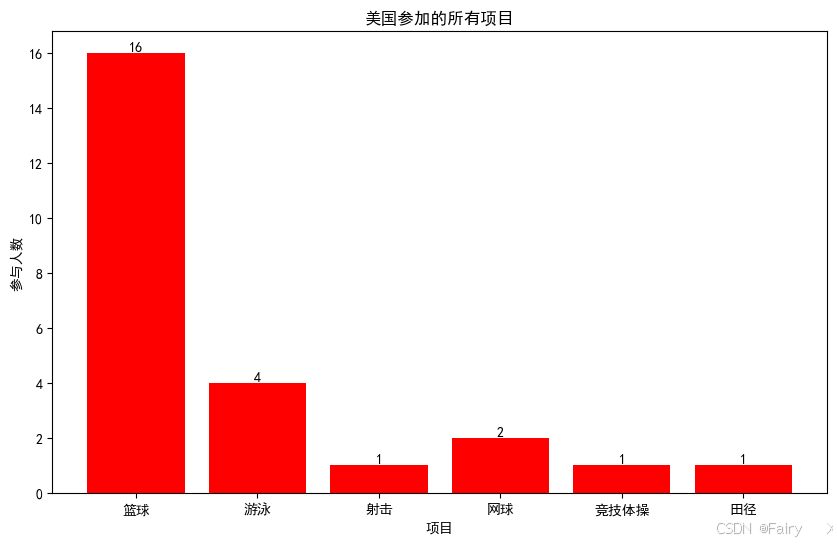
import matplotlib.pyplot as plt
from collections import Counter
plt.rcParams['font.sans-serif'] = ['SimHei']
countries_array = usdata['项目']
country_counts = Counter(countries_array)
labels = country_counts.keys()
sizes = country_counts.values()
colors = plt.cm.tab20.colors
plt.figure(figsize=(6,6))
plt.pie(sizes, labels=labels, colors=colors, autopct='%1.1f%%', startangle=140)
plt.title('美国参加的项目占比')
plt.axis('equal')
plt.show()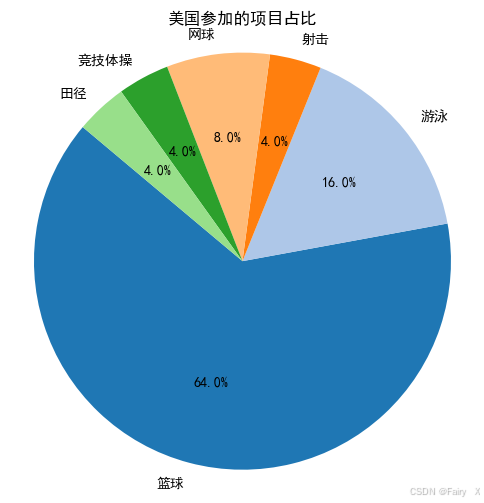
(26)对美国运动员的身高、体重统一单位
对身高进行处理
male_data = usdata[usdata['性别'].apply(lambda x :x == '男')]
male_data = male_data.copy()
male_height = male_data['身高'].dropna()
fill_male_height = round(male_height.apply(lambda x : x[0:-2]).astype(int).mean())
fill_male_height = str(int(fill_male_height)) + '厘米'
male_data.loc[:,'身高'] = male_data.loc[:,'身高'].fillna(fill_male_height )
male_data.loc[:,'身高'] = male_data.loc[:,'身高'].apply(lambda x: x[0:-2]).astype(int)
male_data.rename(columns={'身高':'身高/cm'},inplace=True)
male_data
female_data = usdata[usdata['性别'].apply(lambda x :x == '女')]
female_data = female_data.copy()
data = {'185cm':'185厘米','1.88米':'188厘米','175cm':'175厘米','183cm':'183厘米','198cm':'198厘米','192cm':'192厘米','178cm':'178厘米','145cm':'145厘米','168cm':'168厘米','193cm':'193厘米'}
female_data.loc[:,'身高'] = female_data.loc[:,'身高'].replace(data)
female_height = female_data['身高'].dropna()
fill_female_height = round(female_height.apply(lambda x : x[0:-2]).astype(int).mean())
fill_female_height = str(int(fill_female_height)) + '厘米'
female_data.loc[:,'身高'] = female_data.loc[:,'身高'].fillna(fill_female_height)
female_data['身高'] = female_data['身高'].apply(lambda x: x[0:-2]).astype(int)
female_data.rename(columns={'身高':'身高/cm'},inplace=True)
female_data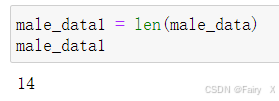
对体重进行处理
female_data.loc[:,'体重'] = female_data.loc[:,'体重'].replace({'66.4kg':'66kg'})
female_data
female_weight = female_data['体重'].dropna()
female_weight = female_weight.apply(lambda x :x[0:-2]).astype(int)
fill_female_weight = round(female_weight.mean())
fill_female_weight = str(int(fill_female_weight)) + 'kg'
female_data.loc[:,'体重'].fillna(fill_female_weight,inplace = True)
female_datausdata = pd.concat([male_data,female_data])
usdata['体重'] = usdata['体重'].apply(lambda x : x[0:-2]).astype(int)
usdata.rename(columns = {'体重':'体重/kg'},inplace = True)
usdata(27)求美国运动员身高、体重的平均值
(28)添加美国运动员的体质指数
usdata['体质指数'] = 0
usdata
def outer(num):
def ath_bmi(sum_bmi):
weight = usdata['体重/kg']
height = usdata['身高/cm']
sum_bmi = weight / (height/100)**2
return num + sum_bmi
return ath_bmiusdata['体质指数'] = usdata[['体质指数']].apply(outer(usdata['体质指数'])).round(1)
usdata(29)查找非正常体质指数的人数
groupby_obj = usdata.groupby(by="性别")
females = dict([x for x in groupby_obj])['女']['体质指数'].values
count = females[females < 19].size + females[females > 24].size
print(f'体质指数小于19:{females[females < 19]}')
print(f'体质指数大于24:{females[females > 24]}')
print(f'非正常体质指数范围的总人数:{count}')
males = dict([x for x in groupby_obj])['男']['体质指数'].values
count = males[males < 20].size + males[males > 25].size
print(f'体质指数小于20:{males[males < 20]}')
print(f'体质指数大于25:{males[males > 25]}')
print(f'非正常体质指数范围的总人数:{count}')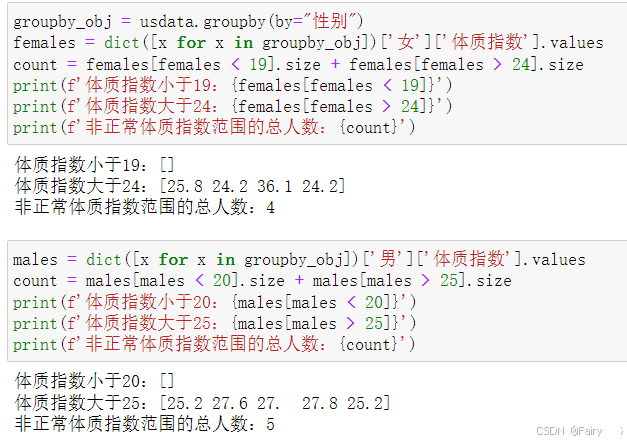
(30)绘制美国运动员出生日期与体质指数的散点图
plt.rcParams['font.sans-serif'] = ['SimHei']
fig = plt.figure(figsize=(20,6))
plt.scatter(usdata['出生日期'],usdata['体质指数'],color='b',linestyle='-')
plt.grid(True,linestyle='-',alpha=0.9)
plt.legend(loc=0)
plt.xticks(x=usdata['出生日期'],rotation=60)
plt.xlabel("运动员的出生日期")
plt.ylabel("体质指数")
plt.title("美国运动员的出生日期与体质指数的关系")
plt.show()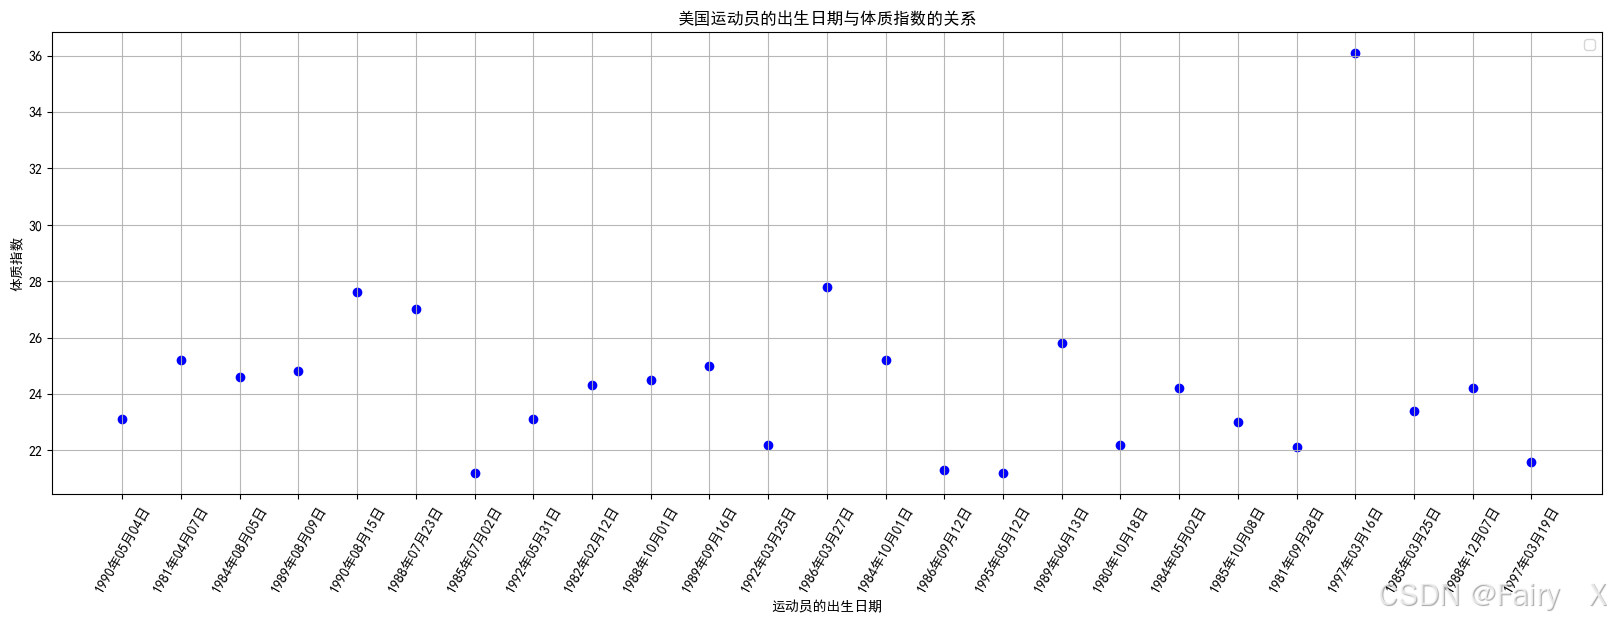
分析全国情况
(31)首先将全部信息进行去重(能够发现重复信息全部是中国运动员信息,所以后去除重复值也是可以的,以上所得结论仍然正确)
all_data1 = all_data[all_data.duplicated().values==True]
all_data1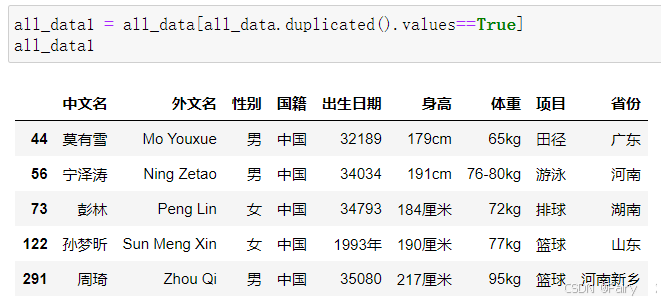
all_data = all_data.drop_duplicates()
all_data = all_data.reset_index(drop=True)
all_data
(32)绘制全国参加项目的柱状图
import matplotlib.pyplot as plt
from collections import Counter
projects = [str(project) for project in all_data['项目']]
participation = Counter(projects)
labels = participation.keys()
sizes = participation.values()
plt.figure(figsize=(40,20))
bars = plt.bar(labels, sizes, color='skyblue')
plt.xticks(x=labels,rotation=60)
plt.xlabel('项目')
plt.ylabel('参与人数')
plt.title('全国参加的所有项目')
for bar in bars:
    height = bar.get_height()
    plt.text(bar.get_x() + bar.get_width()/2, height, '%d' % int(height), ha='center', va='bottom')
plt.show()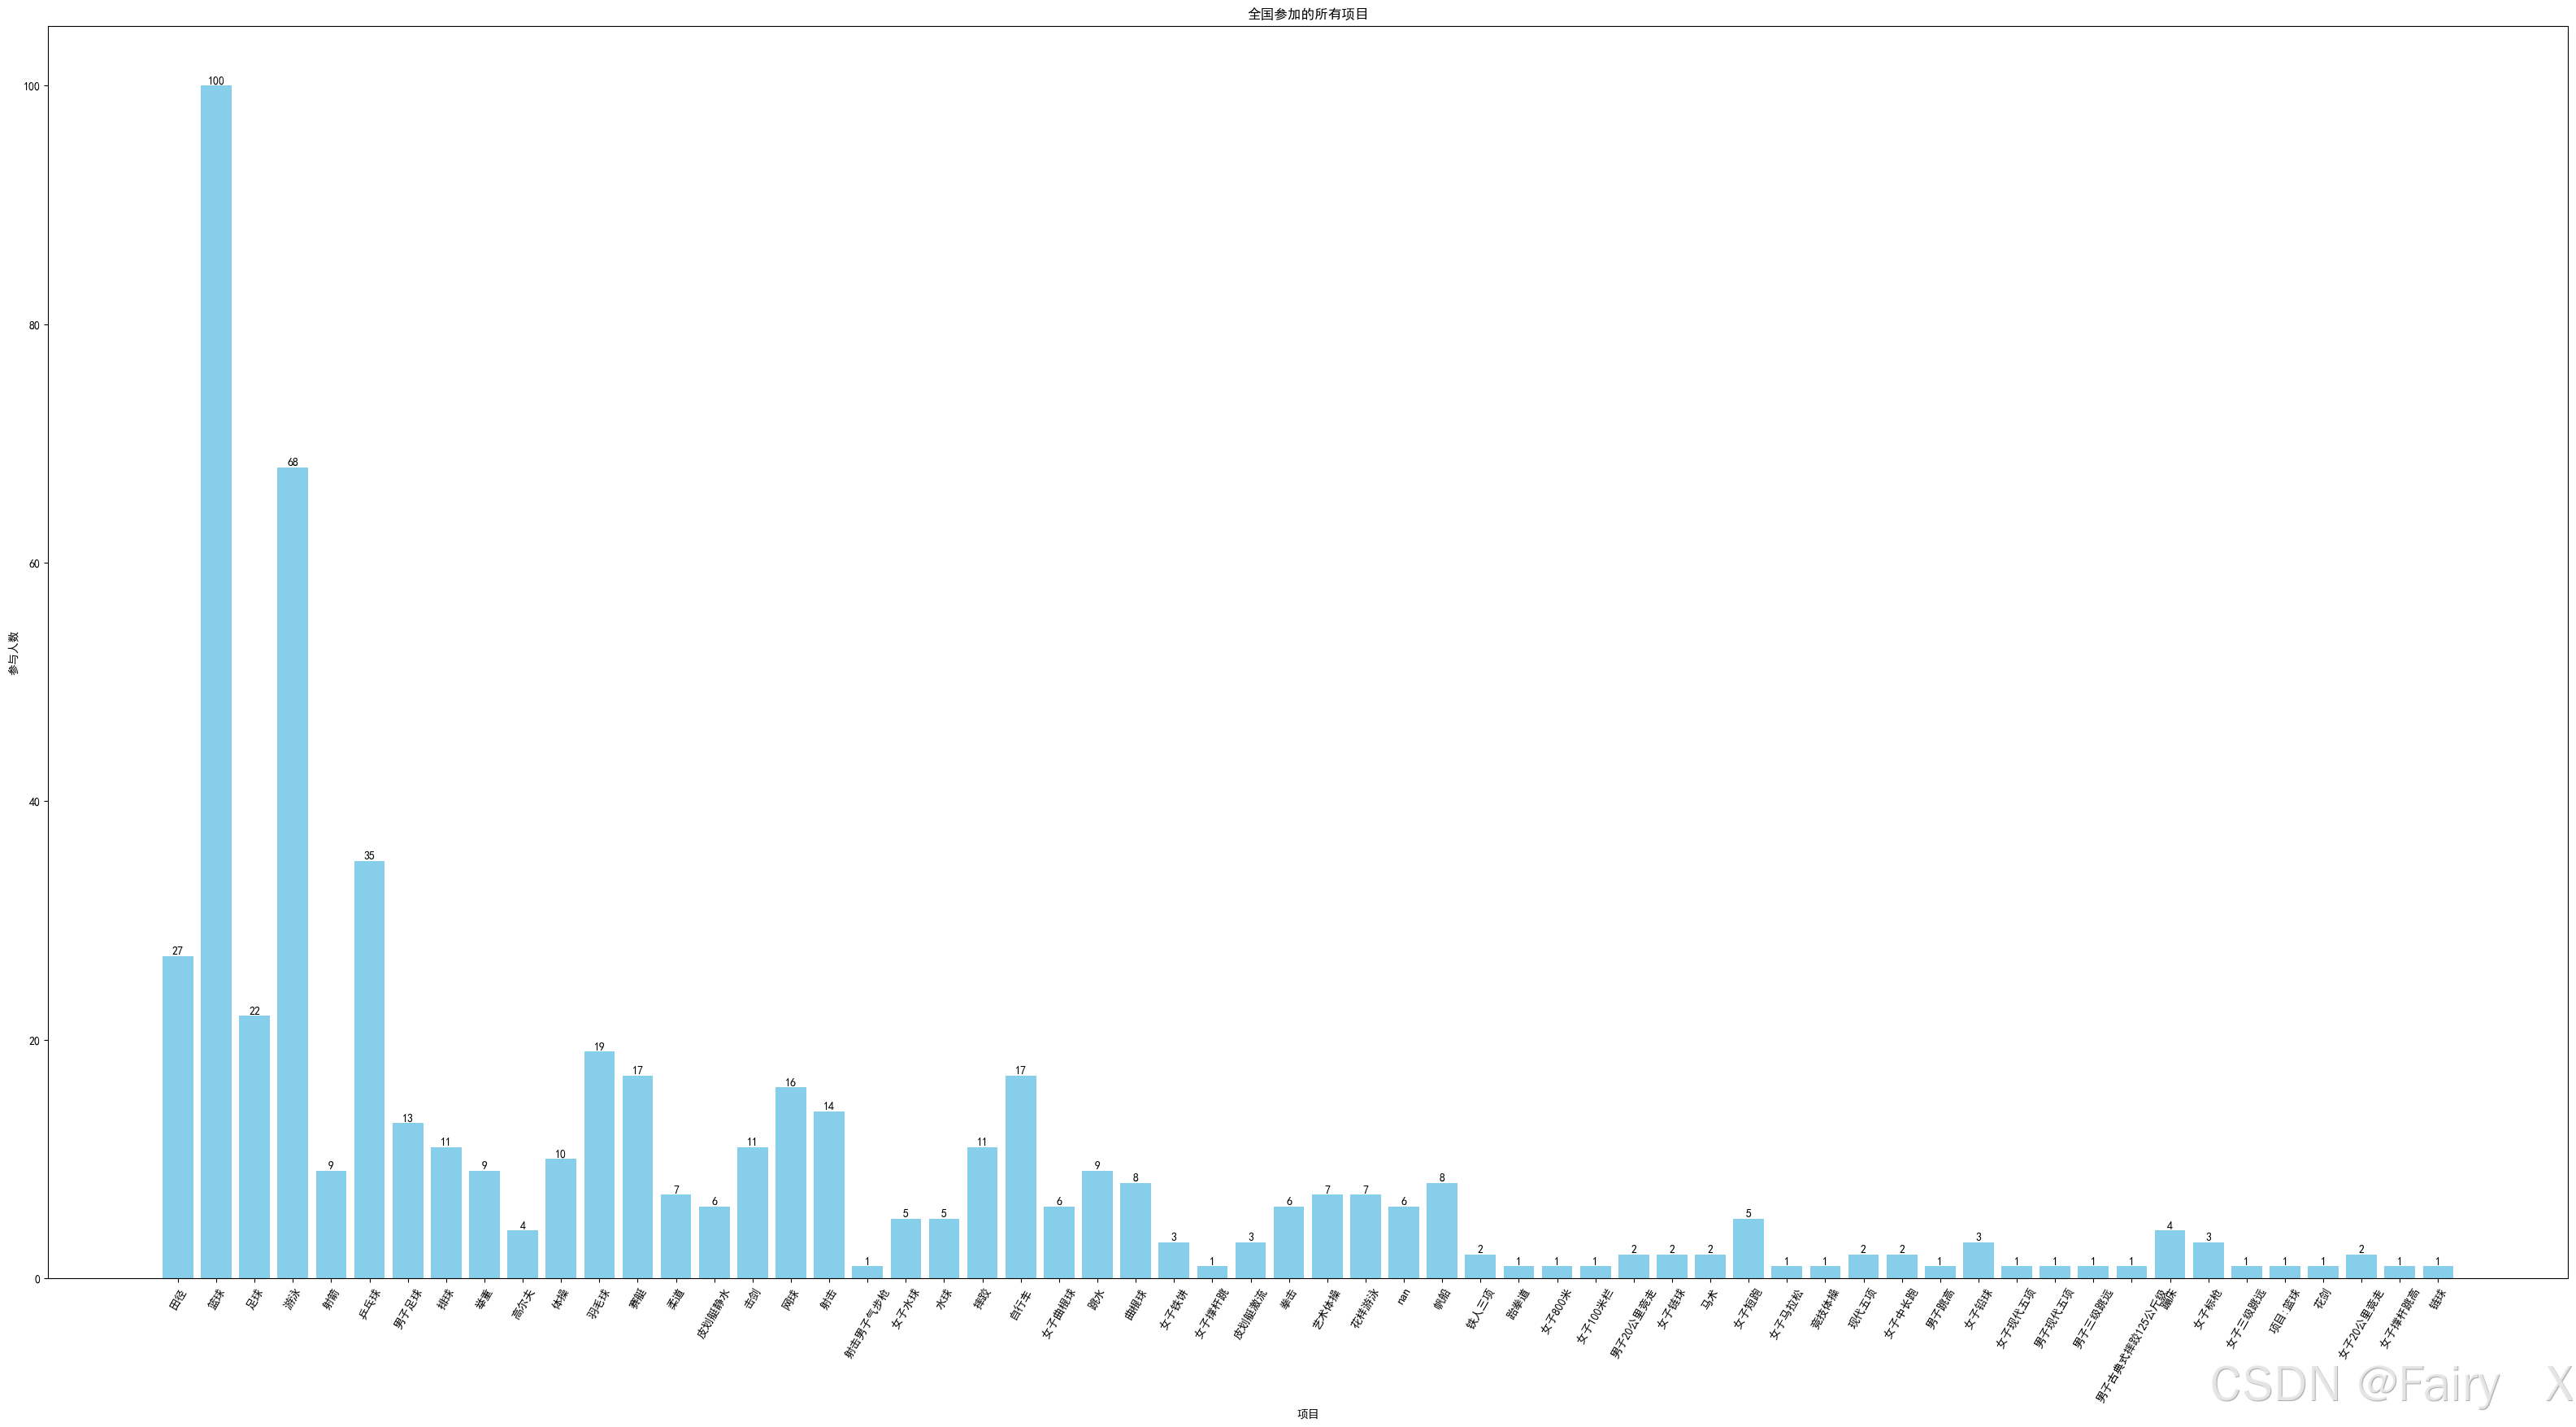
(33)查找全国参加足球运动的运动员信息(发现全部是中国女运动员)
football = all_data[all_data['项目'] == '足球']
football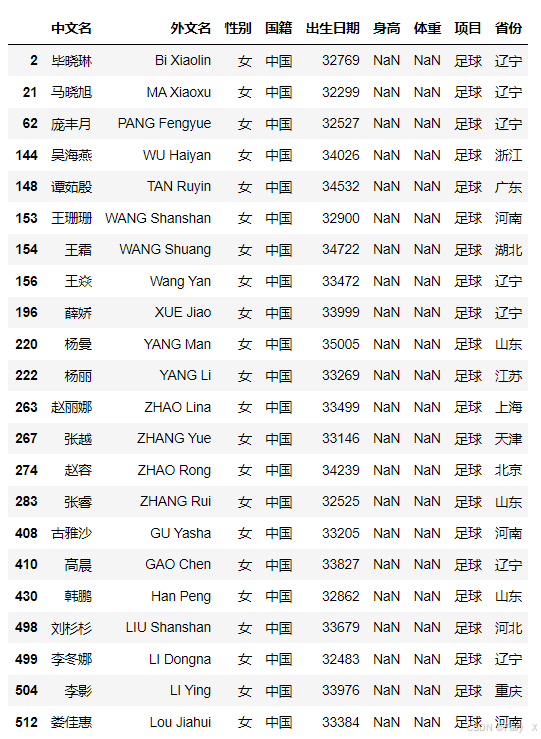
(34)绘制各个省份参加足球情况的饼状图
import matplotlib.pyplot as plt
from collections import Counter
plt.rcParams['font.sans-serif'] = ['SimHei']
countries_array = football['省份']
country_counts = Counter(countries_array)
labels = country_counts.keys()
sizes = country_counts.values()
colors = plt.cm.tab20.colors
plt.figure(figsize=(6,6))
plt.pie(sizes, labels=labels, colors=colors, autopct='%1.1f%%', startangle=140)
plt.title('中国各个省份参加足球项目的人数比例')
plt.axis('equal')
plt.show()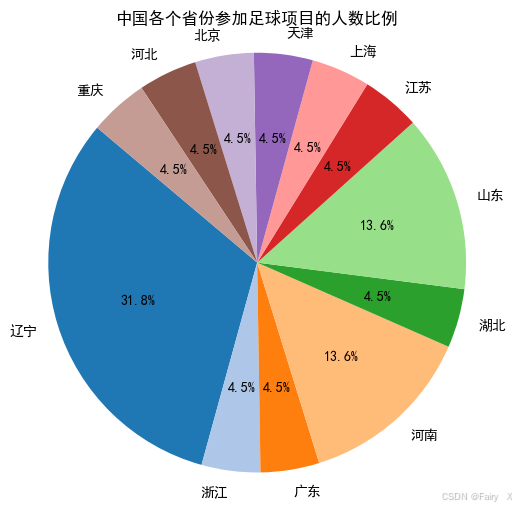
(35)查找全国参加篮球运动的运动员信息
all = all_data[all_data['项目'] == '篮球']
all
(36)绘制各国参加篮球情况的饼状图
import matplotlib.pyplot as plt
from collections import Counter
plt.rcParams['font.sans-serif'] = ['SimHei']
countries_array = all['国籍']
country_counts = Counter(countries_array)
labels = country_counts.keys()
sizes = country_counts.values()
colors = plt.cm.tab20.colors
plt.figure(figsize=(7,7))
plt.pie(sizes, labels=labels, colors=colors, autopct='%1.1f%%', startangle=140)
plt.title('各国参加篮球项目的占比')
plt.axis('equal')
plt.show()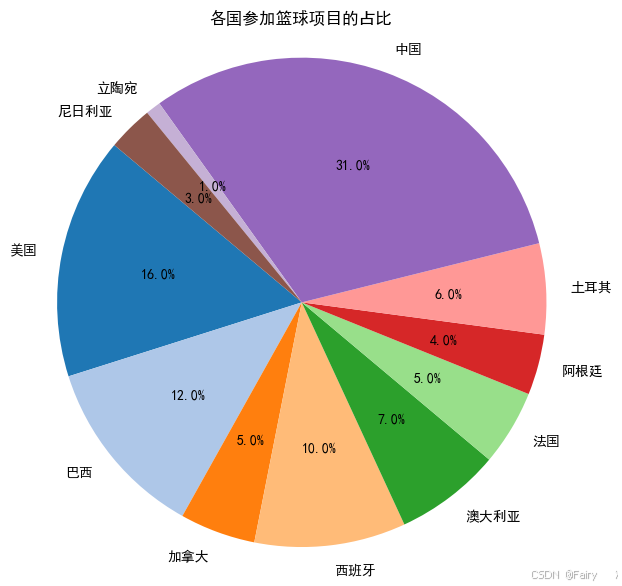
(37)全国打篮球的男女生比例
import matplotlib.pyplot as plt
from collections import Counter
genders = all['性别']
gender_counts = Counter(genders)
print("男生人数:", gender_counts['男'])
print("女生人数:", gender_counts['女'])
categories = ['男', '女']
values = [gender_counts['男'],  gender_counts['女']]
plt.figure(figsize=(4,4))
plt.bar(categories, values)
plt.xlabel('性别')
plt.ylabel('人数')
plt.title('全国打篮球的男女比例')
plt.tight_layout()
plt.show()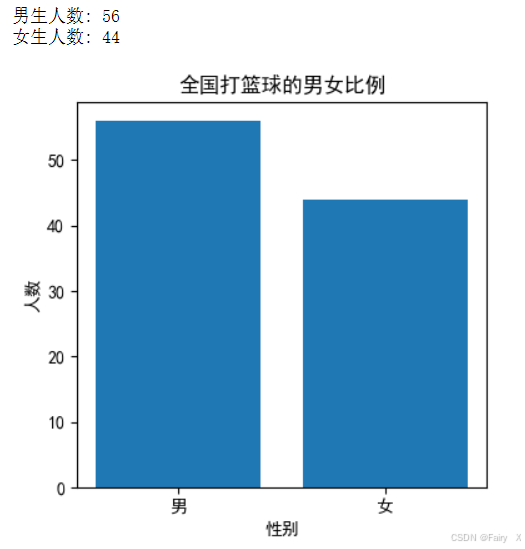


 872
872

 被折叠的 条评论
为什么被折叠?
被折叠的 条评论
为什么被折叠?
 到【灌水乐园】发言


