


应用电力设备变压器数据集进行故障分析 数据预处理、特征工程、模型选择和训练、评估等进行
以下文字及代码仅供参考。
电力变压器数据集中的故障分析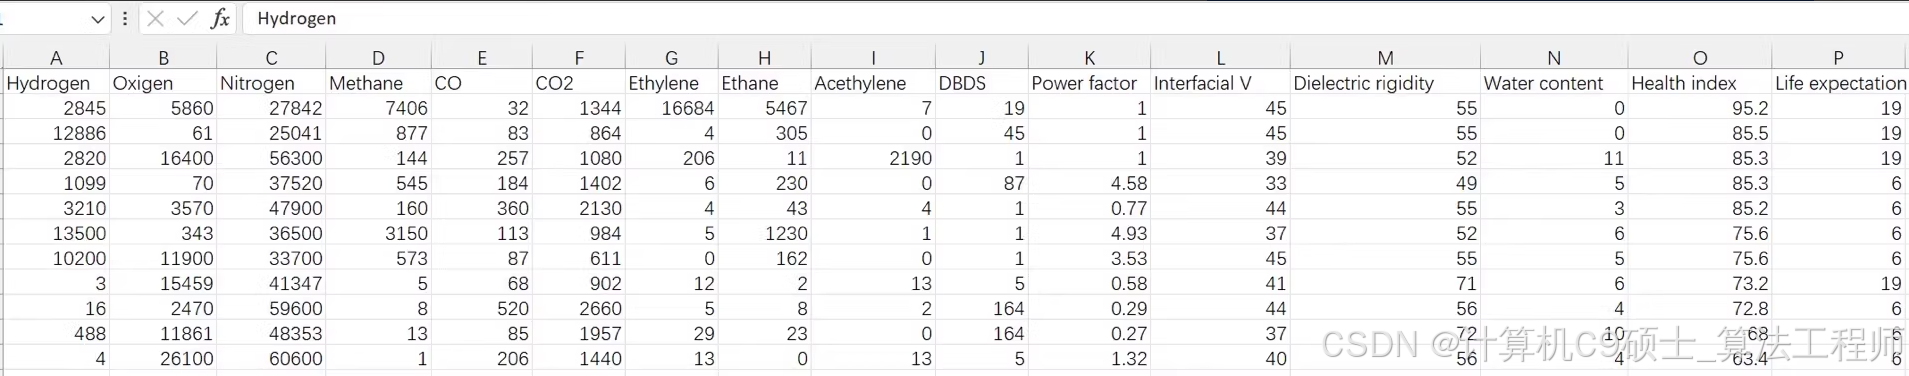
变压器可能由于各种原因而发生故障,但最常见的原因包括雷击、过载、磨损和腐蚀、电涌和潮湿。无论原因如何,结果都是显着的。变压器含有矿物油,可保持变压器冷却。当它变得过度充电时,接线会产生热量和火花。这种巨大的超压最终可能导致变压器破裂,发出巨大的轰鸣声、闪光声,并可能形成一个火球,从而产生从远处可以看到的大量烟雾。
Excel文件
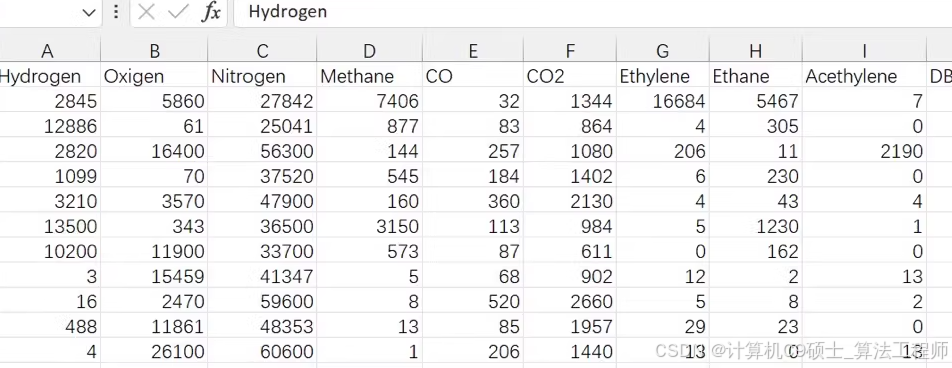
健康指数和电力变压器生成包含 16 个特征的。NO! DGA数据
数据预处理、特征工程、模型选择和训练、评估等步骤。
步骤 1: 数据加载与初步检查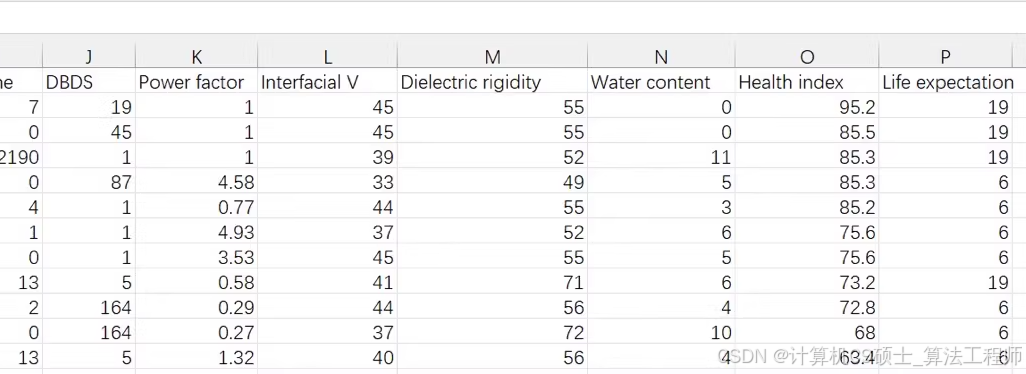
首先,我们需要加载数据并对数据进行初步的探索性数据分析(EDA)以了解数据结构和特征分布。
import pandas as pd

# 加载数据集
data_path = 'path_to_your_excel_file.xlsx'
df = pd.read_excel(data_path)

# 初步查看数据
print(df.head())
print(df.describe())
步骤 2: 数据预处理
根据初步检查的结果,我们可能需要对数据进行一些预处理,如处理缺失值、标准化数值特征等。
# 处理缺失值
df.fillna(df.mean(), inplace=True)  # 使用平均值填充缺失值,具体方法可根据实际情况调整

# 特征缩放
from sklearn.preprocessing import StandardScaler

scaler = StandardScaler()
numerical_features = df.select_dtypes(include=['float64', 'int64']).columns
df[numerical_features] = scaler.fit_transform(df[numerical_features])
步骤 3: 特征工程
基于领域知识和数据分析结果,可以创建新的特征或转换现有特征以提高模型性能。
# 示例:创建一个新的特征
df['feature_interaction'] = df['feature1'] * df['feature2']  # 根据实际需求定义
步骤 4: 模型选择与训练
选择合适的机器学习模型进行训练。对于故障预测问题,可以考虑使用随机森林、支持向量机或者神经网络等算法。
from sklearn.model_selection import train_test_split
from sklearn.ensemble import RandomForestClassifier
from sklearn.metrics import classification_report

# 分割数据集
X = df.drop('health_index', axis=1)  # 假设'health_index'是目标变量
y = df['health_index']
X_train, X_test, y_train, y_test = train_test_split(X, y, test_size=0.2, random_state=42)

# 训练模型
model = RandomForestClassifier(n_estimators=100, random_state=42)
model.fit(X_train, y_train)

# 预测与评估
predictions = model.predict(X_test)
print(classification_report(y_test, predictions))
步骤 5: 结果可视化与解释
为了更好地理解模型预测结果及其对业务的影响,我们可以将结果可视化。
import matplotlib.pyplot as plt
import seaborn as sns

# 绘制混淆矩阵
conf_matrix = confusion_matrix(y_test, predictions)
sns.heatmap(conf_matrix, annot=True, fmt='d')
plt.title('Confusion Matrix')
plt.xlabel('Predicted')
plt.ylabel('Actual')
plt.show()

# 特征重要性
importances = model.feature_importances_
indices = np.argsort(importances)[::-1]

plt.figure(figsize=(12, 6))
plt.title("Feature Importances")
plt.bar(range(X.shape[1]), importances[indices], align="center")
plt.xticks(range(X.shape[1]), X.columns[indices], rotation=90)
plt.tight_layout()
plt.show()
一个基本框架来应用您的电力变压器数据集进行故障分析。根据具体情况,您可能需要调整数据处理方法、特征工程策略及所选模型。帮助开始构建电力变压器故障预测系统


 1509
1509

 被折叠的 条评论
为什么被折叠?
被折叠的 条评论
为什么被折叠?
 到【灌水乐园】发言


