1. expression
If you want to write math symbol or expression in R plot, you can use function expression, which give you a formed latex style. And the expression can be included in
- plot title
plot(..., main=expression(....))
title(expression(...)) - axis anotations
plot(..., xlab=expression(...)) - the plot panel itself
text(x,y, expression(...))
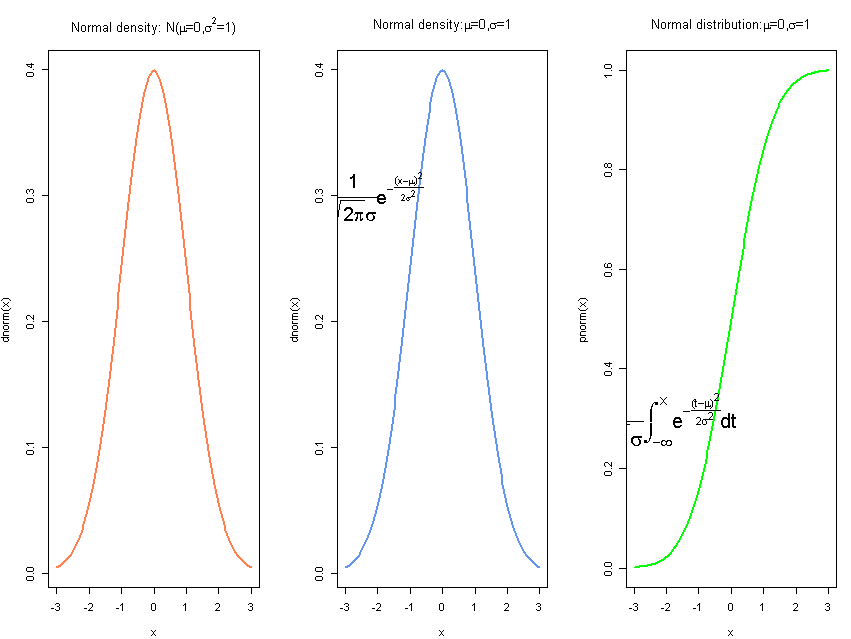
You can use ?plotmath to see how to use math notations in expression. A simple example
# demo
windows()
par(mfrow=c(1,3))
curve(dnorm,-3,3, main=substitute(paste("Normal density: N(", mu,"=",mean,",", sigma^2,"=", sd,")"), list(mean=0,sd=1)), lwd=2, col="coral")

curve(dnorm,-3,3, main=expression(paste("Normal density:", mu, "=", 0, ",",sigma,"=",1 )), col="cornflowerblue",lwd=2)
text(-2,0.3, expression(paste(frac(1,sqrt(2*pi)*sigma),"", e^{-frac((x-mu)^2,2*sigma^2)})),cex=1.8)

curve(pnorm,-3,3, main=expression(paste("Normal distribution:", mu, "=", 0, ",", sigma, "=", 1)), col="green", lwd=2)
text(-2,0.3, expression(paste(frac(1,sqrt(2*pi)*sigma),"", integral(e^{-frac((t-mu)^2,2*sigma^2)}*dt, -infinity, x))), cex=1.9)
So we can see that paste is often used together with expression. If we need to use a value of parameter in expression, substitute may be a more efficient alternative solution.


 821
821

 被折叠的 条评论
为什么被折叠?


