


This is a short code for studying proximal gradient descent algorithm.
#--------------------------- functions to be used ----------------------

## the main function f = g + h
f <- function(x, A, b, lambda){
        1/2*norm(A %*% x - b, "2")^2 + lambda*sum(abs(x))
}
## smooth function g
g <- function(x, A, b){
        1/2*norm(A %*% x - b, "2")^2
}
## subgradient of smooth function
Subg <- function(x, A, b){
        t(A) %*% (A %*% x - b)
}
## proximal function of none smooth function h
prox_L1 <- function(x, lambda){
        sign(x) * pmax(abs(x) - lambda, 0)
}

#------------------------------------- generate data --------------------------------------

# dimension
n <- 500                ## number of samples
p <- 1000               ## number of features
s <- 100                ## number of inportant features
## coefficients
beta <- c(runif(s, -2, 2), rep(0, p- s))
A <- matrix(rnorm(p*p), p, p)
A <- scale(A, TRUE, TRUE)
b <-  A %*% beta + 0.1*rnorm(n)
# tunning paramter
lambda <- 0.1*max(abs(t(A) %*% b))

#-------------------------------- proximal gradient descend -------------------------------
# initilization
t <- 1                   ## step size
beta0 <- 0.5             ## line search for t paramter
x <- rep(10, p)          ## initilization of x
xprev <- x
maxiter <- 200           ## number of iterations

# to obtain objective function value
opt_f <- rep(0, maxiter)

for(i in 1:maxiter){

        cat(i, fill = TRUE)

        # subgradient
        grad_x <- Subg(x, A, b)
        # proximal gradient descend stage and line search
        while(TRUE){

                z <- prox_L1(x - t*grad_x, t*lambda)
                if(g(z , A, b) < g(x, A, b) + t(grad_x) %*% (z - x) + 1/(2*t)*norm(z - x, "2")^2) break
                t <- beta0*t
        }

        # store temp x value
        xprev <- x
        x <- z

        # compute value of objective function
        opt_f[i] <- f(x, A, b, lambda)
        if(i > 1 && (abs(opt_f[i] - opt_f[i-1]) < 10^-8)) break
}

#----------------------------------accelerated proximal gradient descent------------------------

# initilization
t <- 1                   ## step size
beta0 <- 0.5             ## line search for t paramter
x <- rep(10, p)          ## initilization of x
xprev <- x
maxiter <- 200           ## number of iterations

# to obtain objective function value
opt_f_fast <- rep(0, maxiter)

for(i in 1:maxiter){

        cat(i, fill = TRUE)
        # accelarated stage
        y <- x + (i-2)/(i+1)*(x - xprev)

        # subgradient
        grad_y <- Subg(y, A, b)
        # proximal gradient descend stage and line search
        while(TRUE){

                z <- prox_L1(y - t*grad_y, t*lambda)
                if(g(z , A, b) < g(y, A, b) + t(grad_y) %*% (z - y) + 1/(2*t)*norm(z - y, "2")^2) break
                t <- beta0*t
        }

        # store temp x value
        xprev <- x
        x <- z

        # compute value of objective function
        opt_f_fast[i] <- f(x, A, b, lambda)
        if(i > 1 && (abs(opt_f_fast[i] - opt_f_fast[i-1]) < 10^-8)) break
}

#---------------------------plot-----------------------------------------------------------
library(ggplot2)
opt_f[opt_f==0] <- opt_f[which(opt_f!=0)[length(which(opt_f!=0))]]
opt_f_fast[opt_f_fast==0] <- opt_f_fast[which(opt_f_fast!=0)[length(which(opt_f_fast!=0))]]
data <- data.frame(iter=seq(200), opt_f=opt_f, opt_f_fast=opt_f_fast)
# gather data
library(tidyr)
test_data <- gather(data, variable, value, -iter)
ggplot(test_data, aes(x=iter, y=value, color=variable)) +
        geom_line()

# melt data
library(reshape2)
test_data <- melt(data, id="iter")
ggplot(test_data, aes(x=iter, y=value, color=variable)) +
        geom_line()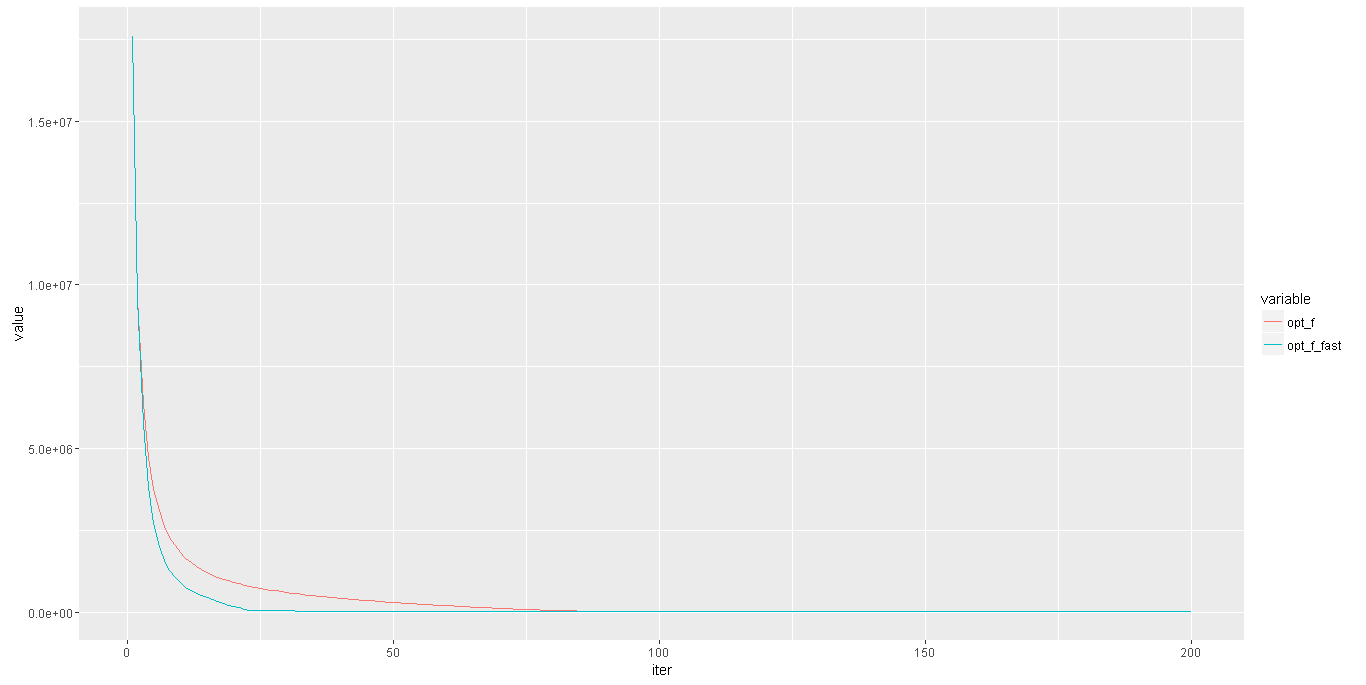


 2270
2270

 被折叠的 条评论
为什么被折叠?
被折叠的 条评论
为什么被折叠?
 到【灌水乐园】发言


