


主副坐标轴显示:
import numpy as np
from matplotlib import pyplot as plt
plt.rcParams['font.sans-serif']=['SimHei']
plt.rcParams['axes.unicode_minus'] = False
x=np.arange(0.1,10,0.01)
data1=np.exp(x)
data2=np.log(x)
fig,ax1=plt.subplots() #subplots一定要带s
ax1.plot(x,data1,c='r')
ax1.set_ylabel('EXP')
ax2=ax1.twinx() #twinx将ax1的X轴共用与ax2,这步很重要
ax2.plot(x,data2,c='g')
ax2.set_ylabel('Log')
plt.show()
补充案例:
数据源:
Unnamed: 0 生均课消 课消总量
0 2024-03 5.25 214209.00
1 2024-04 4.89 199712.00
2 2024-05 5.13 209311.00
3 最终标值 5.01 204523.64
代码:
fig,ax1=plt.subplots()

color='tab:red'
ax1.set_xlabel('月份')  #设置X轴标签
ax1.set_ylabel('生均课消',color=color)  #设置y轴标签的颜色
ax1.plot(df1.iloc[:,0],df1.iloc[:,1],color=color)
ax1.tick_params(axis='y',labelcolor=color)  #设置y轴坐标的颜色

ax2=ax1.twinx()  #共享x的第二个轴,刻度在右侧
color='tab:blue'
ax2.set_ylabel('课消总量',color=color)
ax2.plot(df1.iloc[:,0],df1.iloc[:,2],color=color)
ax2.tick_params(axis='y',labelcolor=color)

for x,y in enumerate(df1.iloc[:,0]):ax1.text(x,y,y,ha='center',va='bottom')  #添加数据标签

fig.tight_layout()  #自动调整子图的参数,可能由于各种原因,图片显示不全,调用该函数进行处理
plt.show()
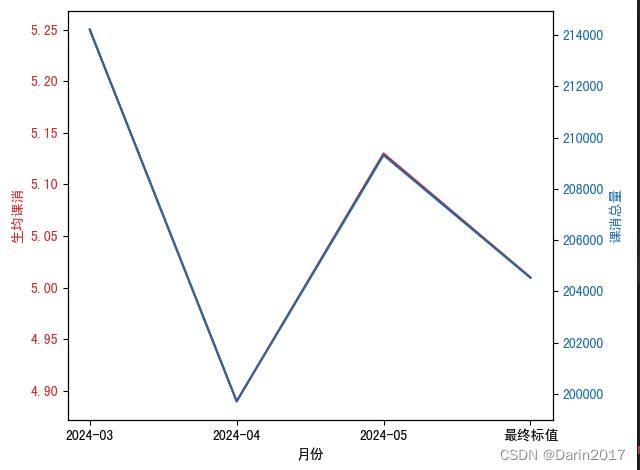
由于两者重合,趋势一致,所以重合
补充案例2:
代码:
df=pd.read_excel(filepath+file1,sheet_name='课消贡献比',index_col=0)
df.index.name=None
print(df.head())
fig,ax1=plt.subplots(figsize=(10,6))
ax1.plot(df['student_user_id'],color='g',label='目标学生数')
ax1.set_xlabel('前一个月课消类型')
# ax1.set_ylabel('目标学生数',color='g')
ax1.tick_params(axis='y',labelcolor='g')
for x,y in enumerate(df['student_user_id']):
ax1.text(x,y,y,color='g',ha='right',va='top')
ax2=ax1.twinx()
ax2.plot(df['最终标值'],color='r',label='课消标值')
ax2.tick_params(axis='y',labelcolor='r')
# ax2.set_ylabel('课消标值',color='r')
for x,y in enumerate(df['最终标值']):
ax2.text(x,y,y,color='r',ha='left',va='bottom')
#ha,即horizontalalignment:水平对齐方式,可以简写ha,参数【'center','right','left'】
#va,即verticalalignment:垂直对齐方式,可以简写为va,参数【'center','top','bottom'】
fig.legend(loc='upper right')
#supported values are 'best', 'upper right', 'upper left', 'lower left', 'lower right', 'right', 'center left', 'center right', 'lower center', 'upper center', 'center'
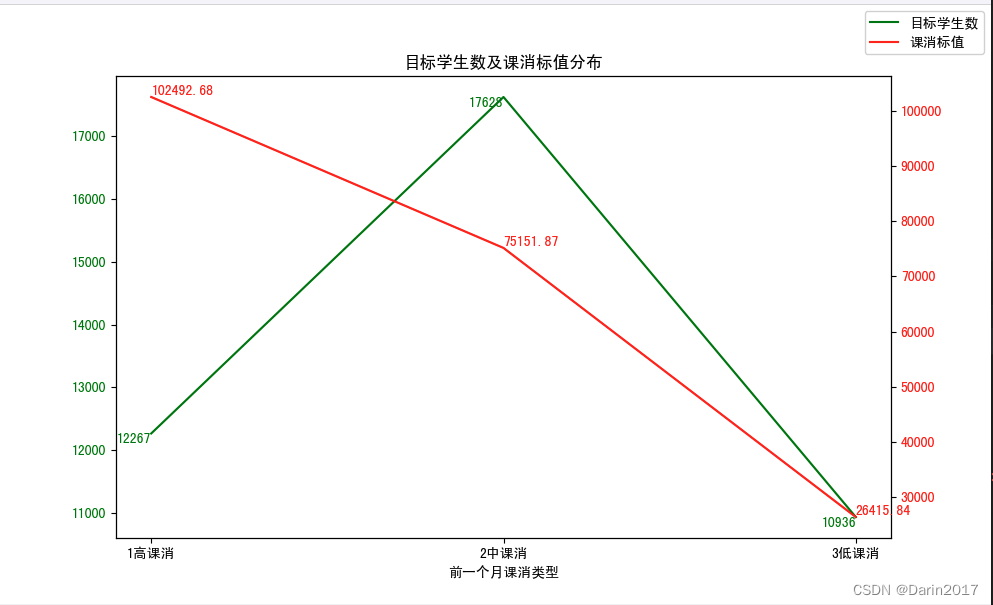
plt.title('目标学生数及课消标值分布')
plt.show()
展示结果:


 1625
1625


 被折叠的 条评论
为什么被折叠?
被折叠的 条评论
为什么被折叠?
 到【灌水乐园】发言


