


 本文深入探讨跨模态检索的评价指标,包括混淆矩阵、精度(precision)、召回率(recall)、F-measure、P-R曲线、平均精度(Average Precision)、平均平均精度(Mean Average Precision)、Precision@K等,解析其在不同场景下的应用与优劣。
跨模态检索评价指标(evaluations of cross-modal retrieval)
1:背景
跨模态检索在实际生活中有着广泛的应用,比如说输入一段话,希望找到对应的图片,再比如说根据一段语音得到与描述大致相同的图像,这些都是跨模态(modality, 如文本,图像,语音等等)检索的例子,本文主要介绍跨模态检索的评价指标,对基本的跨模态检索概念不清楚的话,请首先查阅资料。
最近面试的时候有面试官问我这样一个问题,谷歌也能做到使用图像进行检索,那么跨模态检索和谷歌他们做的检索有什么区别?我的观点是这样的。首先,两者都是检索问题,肯定存在相似的关联,那就是都要通过一个度量方式(metric)来检索出想要的文章。但是,这两者也存在不同,如果你给一张图片的话,百度现在只能返回出相似的图像,实际上这个就是content-based image retrieval(基于内容的图像检索),谷歌能够检索相似的图像,还能够返回一些相关的文章,但是这些相关文章都是包含这幅图像或者包含相似图像的文章(这个大家可以自行试一下)。因此,实际上搜索引擎做的跨模态的检索实际上都是基于内容的检索,不管是文本还是图像,只会在相同的模态中进行检索相似的内容。
但是,跨模态检索的优势就在于,他可以直接比较文本和图像,当然也可以比较图像和图像,因此,如果我们给了一幅图像,如果能够很好的提取出图像中的语义信息,那么检索回来的文本(文章)可能根本不包含这个图像,但是包含的恰恰就是该图像的描述,因此比普通的检索要准确。
2:跨模态检索评价指标
混淆矩阵:
TP(True Positive): 真实为1,预测也为1
FN(False Negative): 真实为1,预测为0
FP(False Positive): 真实为0,预测为1
TN(True Negative): 真实为0,预测也为0
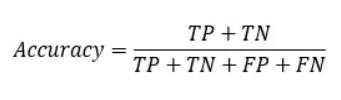
分类模型总体判断的准确率(包括了所有class的总体准确率):
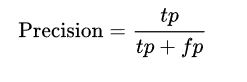
precision(精确率):正例的识别率,比如说一张图片里面有12只狗,我们要做的是物体识别,此时我们识别出8只狗(其中5只是狗,3只是猫),precision=5/8.
recall(召回率):正例的识别率,比如说一张图片里面有12只狗,我们要做的是物体识别,此时我们识别出8只狗(其中5只是狗,3只是猫),recall=5/12.
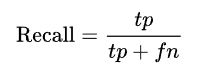
再比如说,搜索引擎返回了30个相关页面,其中20个是真正相关的,实际上另外还有40个相关页面,但是搜索引擎没有返回,那么precision=20/30=2/3,recall=20/(20+40)=1/3.

上面这张图说明了precision和recall之间的联系,中间的圆形代表的返回值(或者是预测为正例,对于上面举的例子来说,返回的8只狗以及30个相关页面就是中间的圆形部分),precision就是返回值中正确判断的概率(返回的正例中实际上也为正例的比例),recall就是返回的正确判断的部分占所有正例的比例。
wiki里面说:Precision can be seen as a measure of exactness or quality, whereas recall is a measure of completeness or quantity. In information retrieval, a perfect precision score of 1.0 means that every result retrieved by a search was relevant (but says nothing about whether all relevant documents were retrieved) whereas a perfect recall score of 1.0 means that all relevant documents were retrieved by the search (but says nothing about how many irrelevant documents were also retrieved).
如果仅仅考虑precision或者recall中的一个的话,是ill-posed的,如果仅仅考虑precision,那么我可以尽可能返回较少的正例,对于搜索引擎这个例子来说,如果我仅仅返回一个相关页面,而且该页面确实也是相关的,那么precision=1,但是我们不能说这是一个好的搜索引擎。如果仅仅考虑recall,那么我可以把所有的样本判断为正例,那么false negtive=0, recall=TP/(TP+FN)=1,对于搜索引擎这个例子来说,就是返回所有的页面,那么recall=1,但是这样同样不能说明这个搜索引擎是好的。
一般来说,precision和recall是此消彼长的,下面用一个外科手术来说明这种关系:
Often, there is an inverse relationship between precision and recall, where it is possible to increase one at the cost of reducing the other.Brain surgery provides an illustrative example of the tradeoff. Consider a brain surgeon tasked with removing a cancerous tumor from a patient’s brain. The surgeon needs to remove all of the tumor cells since any remaining cancer cells will regenerate the tumor. Conversely, the surgeon must not remove healthy brain cells since that would leave the patient with impaired brain function. The surgeon may be more liberal in the area of the brain she removes to ensure she has extracted all the cancer cells. This decision increases recall but reduces precision. On the other hand, the surgeon may be more conservative in the brain she removes to ensure she extracts only cancer cells. This decision increases precision but reduces recall. That is to say, greater recall increases the chances of removing healthy cells (negative outcome) and increases the chances of removing all cancer cells (positive outcome). Greater precision decreases the chances of removing healthy cells (positive outcome) but also decreases the chances of removing all cancer cells (negative outcome).
大致的思想就是,想要增大precision那么结果就是尽可能少的返回正例,那么出错的概率就减小了,但是recall自然就变小了,因为recall希望返回的正例占总的正例尽可能的多。同理,想要增大recall,那么我们可以把所有的都当做正例返回,但是这样的结果就是出错的概率增大了(负例被判断为正例),那么precision自然就减小了。
2.1 F-measure
所以precision以及recall很少被单独作为评价指标,一些根据这两者构成的评价指标,比如说F-measure一般被用来评价算法。
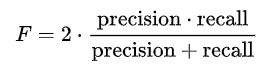
F1-measure评价指标下,recall和precision是同等重要的(权重一致),存在其他的F-measure方法,在这些方法里面,recall和precision的权重就不一定相同:
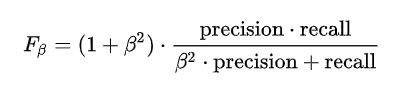
当B=2时,F2-measure更看重recall,反之,当B=0.5的情况下,precision的权重高于recall。 B可以取任意的非负实数。
2.2 P-R curve (precision-recall curve)
Particularly, if true negative is not much valuable to the problem, or negative examples are abundant. Then, PR-curve is typically more appropriate. For example, if the class is highly imbalanced and positive samples are very rare, then use PR-curve. One example may be fraud detection, where non-fraud sample may be 10000 and fraud sample may be below 100.
In other cases, ROC curve will be more helpful.
其说明,如果是不平衡类,正样本的数目非常的稀有,而且很重要,比如说在诈骗交易的检测中,大部分的交易都是正常的,但是少量的非正常交易确很重要,这时候使用PR-curve就更加合适,再比如说搜索引擎检索里面,总的页面非常多,但是检索得到relevent的页面很少,但是relecece很重要,所以用PR-curve更好。其中关于ROC曲线的文章请查看ROC.
当我们根据学习器的预测结果对样例进行排序(排在前面的时学习器认为“最可能”是正例的样本),我们计算每个位置的准确率和召回率,描出来就会得到一个P-R曲线。也就是说,根据预测结果进行排序之后,我们选择1个正例(学习器返回1个正例),我们计算precision以及recall,画出一个点,然后选择2个正例,3个,...,这样就能得到一个曲线。一般情况下,PR-curve在上面的方法效果更好,如下图:

2.3 Average precision
Precision and recall are single-value metrics based on the whole list of documents returned by the system. For systems that return a ranked sequence of documents, it is desirable to also consider the order in which the returned documents are presented. By computing a precision and recall at every position in the ranked sequence of documents, one can plot a precision-recall curve, plotting precision


我们直接根据PR-curve曲线就可以得到average precision,average precision的值就等于PR曲线所围成的面积。
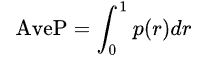
积分形式不好计算,因此下面使用求和式来近似的代替AveP:
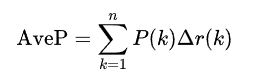
where 


上面的求和式等价于下面的式子:
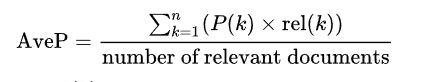
where 
https://stackoverflow.com/questions/43286682/mean-average-precision-map-in-tensorflow
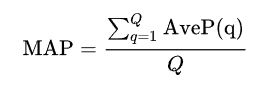
2.4 Mean Average Precision
进行Q次试验(例如检索),求出平均的average precision,就可以得到mAP:
map计算的时候可以在得到的所有检索结果上做,比如说图像检索,总共有10000张图像数据库,现在有32张未知的图像数据,我们使用这32张图像检索10000张图像中相似的图像。map可以在返回的排好序的10000个检索结果上进行,如下:
def calc_map(qB, rB, query_L, retrieval_L):
    # qB: {-1,+1}^{mxq}
    # rB: {-1,+1}^{nxq}
    # query_L: {0,1}^{mxl}
    # retrieval_L: {0,1}^{nxl}
    num_query = query_L.shape[0]
    map = 0
    for iter in xrange(num_query):
        gnd = (np.dot(query_L[iter, :], retrieval_L.transpose()) > 0).astype(np.float32)
        tsum = np.sum(gnd)
        if tsum == 0:
            continue
        hamm = calc_hammingDist(qB[iter, :], rB)
        ind = np.argsort(hamm)
        gnd = gnd[ind]
        count = np.linspace(1, tsum, tsum)

        tindex = np.asarray(np.where(gnd == 1)) + 1.0
        map = map + np.mean(count / (tindex))
    map = map / num_query
    return map
也可以使用top-k map,也就是计算map的时候仅仅使用返回的10000个检索结果中前top-k上计算map,如下代码就是top-50 map:
def calculate_map(test_img_feats_trans, test_txt_vecs_trans, test_labels):
    """Calculate top-50 mAP"""
    start = time.time()
    avg_precs = []
    all_precs = []
    all_k = [50]
    for k in all_k:
        for i in range(len(test_txt_vecs_trans)):
            query_label = test_labels[i]

            # distances and sort by distances
            wv = test_txt_vecs_trans[i]
            #dists = calc_l2_norm(wv, test_img_feats_trans)
            dists = calc_hammingDist(wv, test_img_feats_trans)
            sorted_idx = np.argsort(dists)

            # for each k do top-k
            precs = []
            for topk in range(1, k + 1):
                hits = 0
                top_k = sorted_idx[0: topk]
                # if query_label != test_labels[top_k[-1]]:
                #     continue
                if np.any(query_label != test_labels[top_k[-1]]):
                    continue
                for ii in top_k:
                    retrieved_label = test_labels[ii]
                    if np.all(retrieved_label == query_label):
                        hits += 1
                precs.append(float(hits) / float(topk))
            if len(precs) == 0:
                precs.append(0)
            avg_precs.append(np.average(precs))
        mean_avg_prec = np.mean(avg_precs)
        all_precs.append(mean_avg_prec)
    print('[Eval - txt2img] mAP: %f in %4.4fs' % (all_precs[0], (time.time() - start)))
2.5 Precision@K
For modern (web-scale) information retrieval, recall is no longer a meaningful metric, as many queries have thousands of relevant documents, and few users will be interested in reading all of them. Precision at k documents (P@k) is still a useful metric (e.g., P@10 or "Precision at 10" corresponds to the number of relevant results on the first search results page), but fails to take into account the positions of the relevant documents among the top k.Another shortcoming is that on a query with fewer relevant results than k, even a perfect system will have a score less than 1.It is easier to score manually since only the top k results need to be examined to determine if they are relevant or not.
Precision @k计算的就是返回k个结果时的precision的值。
参考:
https://www.jianshu.com/p/0fc8a0b784f1
https://en.wikipedia.org/wiki/Precision_and_recall
https://blog.csdn.net/taoyanqi8932/article/details/54409314
https://www.douban.com/note/247271147/?type=like


 2132
2132

 被折叠的 条评论
为什么被折叠?
被折叠的 条评论
为什么被折叠?
 到【灌水乐园】发言


