


Compute the bi-dimensional histogram of two data samples.
计算两个变量的二维直方图。
Examples
>>> from matplotlib.image import NonUniformImage
>>> import matplotlib.pyplot as plt
Construct a 2-D histogram with variable bin width. First define the bin edges:
>>> xedges = [0, 1, 3, 5]
>>> yedges = [0, 2, 3, 4, 6]
Next we create a histogram H with random bin content:
>>> x = np.random.normal(2, 1, 100)
>>> y = np.random.normal(1, 1, 100)
>>> H, xedges, yedges = np.histogram2d(x, y, bins=(xedges, yedges))
>>> H = H.T # Let each row list bins with common y range.
imshow can only display square bins:
>>> fig = plt.figure(figsize=(7, 3))
>>> ax = fig.add_subplot(131, title='imshow: square bins')
>>> plt.imshow(H, interpolation='nearest', origin='lower',
... extent=[xedges[0], xedges[-1], yedges[0], yedges[-1]])
numpy.histogram2d — NumPy v1.22 Manual

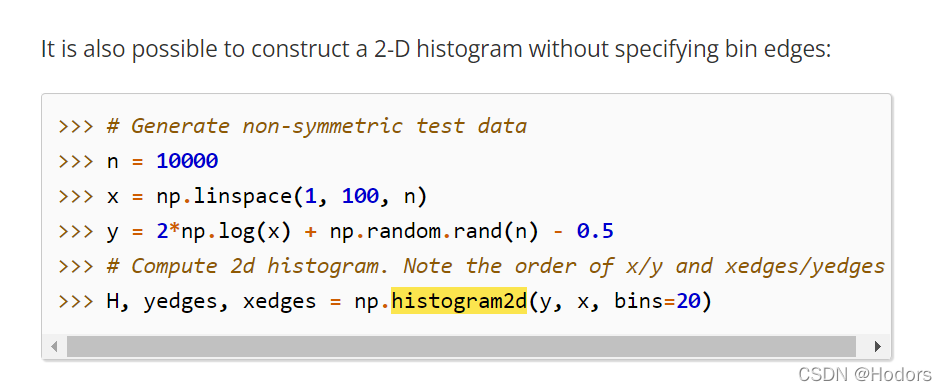
当然,也可以不用指定bin edge,只给出bin的数量;


 1万+
1万+

 被折叠的 条评论
为什么被折叠?
被折叠的 条评论
为什么被折叠?
 到【灌水乐园】发言


