


We have already seen what amazing discovery, analysis, and data storytelling is possible in Tableau by simply connecting to data and dragging and dropping fields. Now, we'll set off on an adventure with calculations.
Calculations significantly extend the possibilities for analysis, design, and interactivity in Tableau. In this chapter, we'll see how calculations can be used in many different ways. We'll see how calculations can be used to address common issues with data, extend the data by adding new dimensions and measures, and provide additional flexibility in interactivity.
At the same time, while calculations provide incredible power and flexibility, they introduce a level of complexity and sophistication. As you work through this chapter, try to understand the key concepts behind how calculations work in Tableau. As usual, follow along with the examples, but feel free to explore and experiment. The goal is not to merely have a list of calculations you can copy, but to gain knowledge of how calculations can be used to solve problems and add creative functionality to your visualizations and dashboards.
The first half of this chapter focuses on laying a foundation, while the latter gives quite a few practical examples. The topics we will study here are as follows:
- Creating calculations
- Overview of the four main types of calculations
- Row-level examples
- Aggregate-level examples
- Level of detail examples
- Parameters
- Practical examples
- Performance considerations
We'll examine table calculations in the next chapter.
Introduction to calculations
A calculation is often referred to as a Calculated Field in Tableau because, in most cases, when you create a calculation, it will show up as either a new measure or dimension in the data pane. Calculations consist of code that's made up of functions, operations, and references to other fields, parameters, constants, groups, or sets. This code returns a value. Sometimes, this result is per row of data, and sometimes it is done at an aggregate level. We'll consider the difference shortly.
Creating and editing calculations
There are multiple ways to create a calculated field in Tableau:
- Select Analysis | Create Calculated Field... from the menu.
 OR
OR 
- Use the drop-down menu next to Dimensions in the Data pane.
- Right-click an empty area in the data pane and select Create Calculated Field....
- Use the drop-down menu on a field, set, or parameter in the data pane and select Create | Calculated Field....
- Double-click an empty area on the Rows, Columns, or Measure Values shelves, or in the empty area on the Marks card to create an ad hoc calculation.
https://help.tableau.com/current/pro/desktop/en-us/calculations_calculatedfields_adhoc.htm#:~:text=in%2Dline%20calculations.-,Create%20an%20Ad%2DHoc%20Calculation,or%20elsewhere%20in%20the%20view.
When you start your calculation from an existing field or parameter, the calculation starts as a reference to that field. The calculated field you create will be part of the data source that is currently selected at the time you create it. You can edit an existing calculated field in the data pane by using the drop-down menu and selecting Edit....
The interface for creating and editing calculations looks like this:
This window has several key features:
- 1. Calculated field name: Enter the name of the calculated field here. Once created, the calculated field will show up as a field in the data pane with the name you entered in this text box.
- 2. Code editor: Enter code in this text area to perform the calculation. The editor includes autocomplete for recognized fields and functions. Additionally, you may drag fields, sets, and parameters from the data pane or view into the code editor to insert them into your code.
You may also select snippets[ˈsnɪpɪts]片段 of your code in the Code editor window and then drag and drop the selected text into the data pane to create additional calculated fields. You may also drag and drop selected code snippets from the code window onto shelves in the view to create ad hoc calculations.https://help.tableau.com/current/pro/desktop/en-us/calculations_calculatedfields_adhoc.htm#:~:text=in%2Dline%20calculations.-,Create%20an%20Ad%2DHoc%20Calculation,or%20elsewhere%20in%20the%20view.
This is an effective way to test portions of complex calculations. - 3. An indicator at the bottom of the editor will alert you with errors in your code. Additionally, if the calculation is used in views or other calculated fields, you will see a drop-down indicator that will let you see the dependencies. Click the Apply button to apply changes to the calculation throughout the workbook while leaving the calculation editor open. The OK button will save the code changes and close the editor. If you wish to discard any changes you've made, click the X button in the upper-right corner to cancel changes.
- 4. The functions list contains all of the functions that you can use in your code. Many of these functions will be used in examples or discussed in this chapter. Tableau groups various functions according to their overall use:Functions in Tableau - Tableau
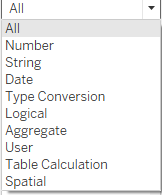
- Number: Mathematical functions, such as rounding, absolute value, trig functions, square roots, and exponents.
- String: Functions that are useful for string manipulation, such as getting a substring, finding a match within a string, replacing parts of a string, and converting a string value to uppercase or lowercase.
- Date: Functions that are useful for working with dates, such as finding the difference between two dates, adding an interval to a date, getting the current date, and transforming strings with non-standard formats into dates.
- Type Conversion: Functions that are useful for converting one type of field to another, such as converting integers into strings, floating point decimals into integers, or strings into dates.
- Logical: Decision-making functions, such as if then else logic or case statements.
- Aggregate: Functions that are used for aggregating such as summing, getting the minimum or maximum values, or calculating standard deviations or variances.
- Pass Through: (only available when connected live to certain databases, such as SQL Server): These functions allow you to pass through raw SQL code to the underlying database and retrieve a returned value at either a row level or aggregate level.
- User: Functions that are used to obtain usernames and check whether the current user is a member of a group. These functions are often used in combination with logical functions to customize the user's experience or to implement user-based security when publishing to Tableau Server or Tableau Online.
- Table calculation: These functions are different from the others. They operate on the aggregated data after it is returned from the underlying data source and just prior to the rendering of the view. These are some of the most powerful functions in Tableau. We'll devote an entire chapter to them so that we can cover them.
-
Spatial Functions
-
Selecting a function in the list or clicking a field, parameter, or function in the code will reveal details about the selection on the right. This is helpful when nesting other calculated fields in your code, when you want to see the code for that particular calculated field, or when you want to understand the syntax for a function.
Additional functions and operators
Tableau supports numerous functions and operators. In addition to the functions that are listed on the calculation screen, Tableau supports the following operators, key words, and syntax conventions:
- AND: Logical and between two Boolean ( true / false ) values or statements
- OR: Logical or between two Boolean values or statements
- NOT: Logical not to negate a Boolean value or statement
- = or ==: Logical equals to test equality of two statements or values (single or double equal signs are equivalent in Tableau's syntax)
- +: Addition of numeric or date values or concatenation of strings
- -: Subtraction of numeric or date values
- *: Multiplication of numeric values
- /: Division of numeric values
- ^: Raise to a power with numeric values
- (): Parenthesis to define order of operations or enclose function arguments
- []: Square brackets to enclose field names
- {}: Curly braces to enclose level of detail calculations
- //: Double slash to start a comment
Tip
Field names that are a single word may optionally be enclosed in brackets when used in calculations. Field names with spaces, special characters, or from secondary data sources must be enclosed in brackets.
Four main types of calculations
The groupings of functions we mentioned previously are important for understanding what kind of functionality is possible. However, the most fundamental way to understand calculations in Tableau is to think of four major types of calculations:
- Row-level calculations: These calculations are performed for every row of underlying data.

- Aggregate-level calculations: These calculations are performed at an aggregate level, which is usually defined by the dimensions used in the view.

- Level of detail calculations: These special calculations are aggregations that are performed at a specified level of detail, with the results available at the row level. Level of detail calculations allow you to define the level of detail at which
- aggregations are performed and
- then work with the results at a row level
- Table calculations: These calculations are performed at an aggregate level on the table of aggregate data that has been returned by the data source to Tableau.
Transform Values with Table Calculations - Tableau
In this chapter, we'll take a close look at three of the four main types of calculations in Tableau: row level, aggregate level, and level of detail calculations. We'll dive into table calculations in detail in the next chapter, Chapter 5 , Diving Deep with Table Calculations.
Example data
Before we get started with some examples, let's consider a sample dataset that will be used for the examples in this chapter. It's simple and small, which means we will be able to easily see how the calculations are being done.
This dataset is included as Vacation Rentals.csv in the \Learning Tableau\Chapter 04 directory of this book's resources, and is also included in the Chapter 4 workbook as a data source named Vacation Rentals:
The dataset describes several vacation rental properties, the renters, the start and end dates of the rental period, the discount, and the rent.
Row-level calculations
We might know that the naming convention of the rental unit in the vacation rental data actually gives us the room number and the name of the building. For example, the unit named 207-Beach Breeze is room 207 of the Beach Breeze condo complex.
In the Chapter 04 workbook, create a couple of calculated fields.
Right-click an empty area in the data pane and select Create Calculated Field....
Name the first Room with the following code:
SPLIT(string, delimiter, token number)
SPLIT([Rental Property], "-", 1)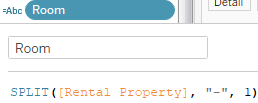
Then, create another calculated field named Building with the following code:
SPLIT([Rental Property], "-", 2) 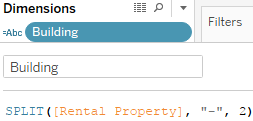
Both of these functions use the Split() function, which splits a string into multiple values and keeps one of those values. This function takes three arguments:
- the string,
- the delimiter (a character or set of characters that separate values), and
- the token number (which value to keep from the split, that is, 1st , 2nd , 3rd , and so on.)
Using the - (dash) as the delimiter, the Room is the first value and Building is the second.
Using the two calculated fields, create a bar chart of Rent per Building and Room, similar to this:
The Building and Room fields show up in the data pane under Dimensions. The calculated dimensions can be used just like any other dimension. They can slice the data, define the level of detail, and group measures.
Row-level calculations are calculated at a row level, but you can choose to aggregate the results. For example, you could aggregate to find the highest Room number (MAX) or count the distinct number of Buildings (COUNTD) . In fact, if the result of a row-level calculation is numeric, Tableau will often place the resulting field under Measures by default. As we've seen before, the default use of a field can be changed from a measure to a dimension, or vice versa, by dragging and dropping it within the data pane.
Note that Tableau adds a small equals sign to the icon of the fields in the data pane to indicate that they are calculated fields: ==>
==>
The code for both calculated fields is executed for every row of data and returns a row-level value. We can verify that the code is operating on a row level by examining the source data. Simply click on the View Data icon![]() next to dimensions to see the row-level detail (it's next to the magnifying[ˈmæɡnɪfaɪɪŋ]放大的 glass icon in the preceding screenshot). Here, the new fields of Building and Room, along with the row-level values, can be clearly seen.
next to dimensions to see the row-level detail (it's next to the magnifying[ˈmæɡnɪfaɪɪŋ]放大的 glass icon in the preceding screenshot). Here, the new fields of Building and Room, along with the row-level values, can be clearly seen.
Tip
Tableau actually provides a shortcut for splitting a field. You can use the drop-down menu on a field in the data pane and select Transform | Split or Transform | Custom Split (if you have a non-standard delimiter)
 . The results are calculated fields that are similar to those you created previously, but with some additional logic around determining data types. Transform functionality, such as split, is also available for fields in the Preview or Metadata views on the Data Source screenhttps://blog.csdn.net/Linli522362242/article/details/123020380.
LEFT(string, num_chars)
You can also build calculations that use other calculations. This is referred to as nesting, and the resulting calculations are called nested calculations.
For example, let's say that you know that the floor of a room is indicated by its number. Rooms 100 through 199 are on the 1st floor, and 200 through 299 are on the 2nd. You'd like to have that information available for analysis.
We could potentially add this attribute to the source data, but there are times when this may not be an option or may not be feasible. We may not have permission to change the source data or the source might be a spreadsheet that is automatically generated every day, and any changes would be overwritten.
Instead, we can create a row-level calculation in Tableau to extend the data. To do so, create a calculated field named Floor with the following code: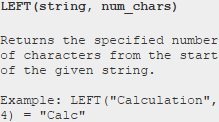
IF LEFT([Room],1)=="1"
THEN "First Floor"
ELSEIF LEFT([Room],1)=="2"
THEN "Second Floor"
END
==>
==>
This code uses the LEFT() function to return the leftmost character of the room. Thus, 112 gives a result of 1 ; 207 gives a result of 2 . The IF THEN END logic allows us to assign a result (either First Floor or Second Floor ), depending on which case is true. Notice that you used the Room field in the calculation, which, in turn, was another calculation. There is no limit to the levels of nesting you can use.
MID(string, start, [length])
Tip
A couple of good questions to ask yourself whenever you write a calculation in Tableau are as follows: What happens if the data changes? Have I covered every case? For example, the preceding floor calculation only works if all of the rooms are either 100 or 200 level rooms. What if there is a room, 306, on the 3rd floor, or a room, 822, on the 8th floor?
To account for additional cases, we might simplify our calculation to the following:
LEFT([Room] , 1) This code simply returns the leftmost character of the room number. We'll get 3 for 306 and 8 for 822 . But what if we have room numbers such as 1056 on the 10th floor, and 1617 on the 16th? We'd have to consider other options, such as the following:
MID([Room] , 0, LEN([Room]) - 2)Although this is more complicated, the string functions return a substring that starts at the beginning of the string, but stop short of the last 2 characters(Note: the last 2 digits represent which room on the floor). That gives us floor 10 for 1025 , and floor 18 for 1856.
Concatenation
To wrap up our row-level examples, let's create one more calculation. Create a new calculated field called Full Name with the following code:
[First name] + " " + [Last name] 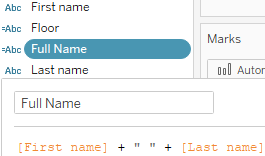 ==>
==>
This code concatenates the strings of First name and Last Name with a space in-between them. We now have a single field that will display the full name of the individual renter.
Aggregate-level calculations
row-level [Discount] / [Rent] vs SUM( [Discount] ) /SUM( [Rent] )
We've already considered aggregations such as sum, min, and max in Tableau. Often, you'll use fields as simple aggregations in the view. But sometimes, you'll want to use aggregations in more complex calculations.
For example, you might be curious to explore the percentage of the rent that was discounted. There is no such field in the data. It could not really be stored in the source, because the value changes based on the level of detail present in the view (for example, the percent discounted for an individual unit will be different to the percent discounted per floor or per building). Rather, it must be calculated at as an aggregate and recalculated as the level of detail changes.
Aggregate-level SUM( [Discount] ) /SUM( [Rent] )
Let's create a calculation named Discount % with the following code:
SUM([Discount])/SUM([Rent]) 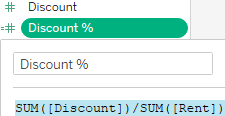 ==>
==> Note: Since the dataset exist rental period, so Aggregate-level is equal to row level, Discount rate is the discount rate for each lease in each row of data(the Discount % given by way of discount for each rental period)
This code indicates that the sum of Discount should be divided by the sum of Rent . This means that all of the values of Discount will be added and all of the values of Rent will be added. Only after the sums are calculated will the division occur.
Once you've created the calculation, you'll notice that Tableau places the new field under Measures. Tableau will place any calculation with a numeric result under Measures by default, but you can change row-level calculations to dimensions if desired. In this case, though, you are not even able to redefine the new field as a dimension. The reason for this is that Tableau will treat every aggregate calculation as a measure, no matter what data type is returned. This is because an aggregate calculation depends on dimensions to define the level of detail at which the calculation is performed. So, an aggregate calculation cannot be a dimension itself.
Tip
As the value of your calculation is a percent, you will also likely want to define the format as a percent. To do this, right-click the Discount % field, select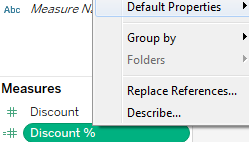 Default Properties | Number Format, and select Percentage. You may adjust the number of decimal places that are displayed if desired.
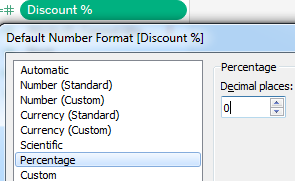
Now, create a couple of views to see how the calculation returns different results, depending on the level of detail in the view. First, we'll build a view to take a look at each individual rental period:
- 1. Place Building, Room, Full Name, Start, and End on Rows.
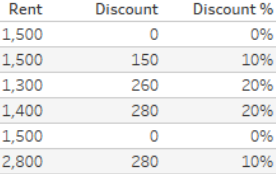
- 2. In the data pane, under Measures, double-click each of the following fields: Rent , Discount , and Discount % . Tableau will place each of these measures in the view by using Measure Names and Measure Values .
- 3. Rearrange the fields on the Measure Values shelf so that the order is Rent , Discount , and Discount %:

You can see the percentage given by way of discount for each rental period. However, notice how the values change when you remove all fields except Building and Room 
Why did the values change? Because aggregations depend on what dimensions are defining the level of detail of the view.
- In the first case, Building and Room , Full Name , Start , and End defined the level of detail in the view. So, the calculation added up all the rent for each rental period and all the discounts for the rental period and then divided them.
- In the second case, Building and Room redefine the level of detail. So, the calculation added up all the prices for each building and room and all the discounts for each building and room and then divided them.
Tip
Measure Names and Measure Values are special fields that appear in every data connection (at the bottom of the Dimensions section and Measures section, respectively). These serve as placeholders for multiple measures that share the same space in the view. In the view you just created, for example, 3 measures all shared space in the pane. Measure Values on Text![]() indicated that all values of measures on the
indicated that all values of measures on the 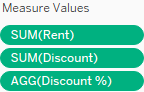 Measure Values shelf should be displayed as text. The Measure Names field
![]() on Columns created a column for each measure, with the value of the name of that measure.
on Columns created a column for each measure, with the value of the name of that measure.
Notice that the values change again, as expected, if you look at the overall dataset without slicing by any dimensions: ==>
==>
Tip
An easy way to get Tableau to implement Measure Names / Measure Values is to remember that they are used whenever you want to use two or more measures in the same space in a view.
Why the row-level/aggregate-level difference matters
Let's say you created a Discount % (row-level) calculation with the following code:
//calculates the percent per row -- this is WRONG!
[Discount] / [Rent]
The code differs from the aggregate calculation you created previously, which had the following code:
SUM([Discount])/SUM([Rent]) right-click the Discount % (row-level) field, select Default Properties | Number Format, and select Percentage. You may adjust the number of decimal places that are displayed if desired.
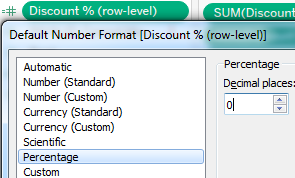
Here is the dramatic difference in results:
Why is there such a difference in the results? It's a result of the way the calculations were performed. Discount % = 970/10000 = 10%
Notice that Discount % (row-level) appears on the Measure Values shelf as a SUM. That's because the calculation is a row-level calculation, so it gets calculated row by row and then aggregated as a measure after all row-level values have been determined. The 60% value you see is actually a sum of percentages that were calculated in each record of underlying data.
In fact, the row-level calculation and then final aggregation is performed like this:
Contrast that with the way the aggregate-level calculation is performed. Notice that the aggregation that's listed on the active field on the Measure Values shelf in the view is AGG , and not SUM . This indicates that you have defined the aggregation in the calculation. Tableau is not aggregating the results further. Here is how the aggregate-level calculation is performed:
It is vital to understand the difference between row-level and aggregate-level calculations to ensure you are getting the results you expect and need. In general,
- use row-level calculations when you are certain that you will use either the value as a dimension or that an aggregation of the row-level values will make sense.
- Use aggregate calculations if aggregations must be performed prior to other operations.
Tip
One of the most common error messages that's encountered while writing Tableau calculations is Cannot mix aggregate and non-aggregate arguments with this function. When you encounter this message, check your code to make sure you are not improperly mixing row-level fields and calculations with aggregate fields and calculations. For example, you cannot have something like [Discount] / SUM( [Rent] ) . This mixture of a row-level value ( Discount ) and the aggregation ( SUM of Rent ) is invalid. 
Level of detail calculations
Level of detail calculations (sometimes referred to as LOD calcs or LOD expressions) are a fourth type of calculation that allow you to perform aggregations at a specified level of detail, which may be different from the level of detail that was defined in the view. In many cases, you can then work with the resulting value at a row-level. In this way, you might think of LOD calculations as a hybrid between aggregate calculations and row-level calculations.
Level of detail syntax
Level of detail calculations follow this basic pattern of syntax:
{ FIXED| INCLUDE| EXCLUDE [Dim 1] , [Dim 2] : AGG([Row-Level] ) }Definitions of the preceding declaration are as follows:
- FIXED , or INCLUDE , or EXCLUDE , is a keyword that indicates the type of LOD calculation. We'll consider the differences in detail in the following section.
- Dim 1 , Dim 2 (and as many dimensions that are needed) are a comma-separated list of dimension fields that define the level of detail at which the calculation will be performed. You may use any number of dimensions to define the level of detail.
- AGG is the aggregate function you wish to perform (such as SUM , AVG , MIN , and MAX ).
- Row-Level is the row-level field or row-level calculation that will be aggregated as specified by the aggregation you choose.
Level of detail types
Three types of level of detail calculations are used in Tableau: FIXED , INCLUDE , and EXCLUDE
FIXED
Fixed level of detail expressions aggregate at the level of detail that's specified by the list of dimensions in the code, regardless of what dimensions are in the view. For example, the following code returns the per Building average Rent , regardless of what other dimensions are in the view(such as ![]() ):
):
{FIXED [Building] : AVG([Rent])} 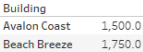 and
and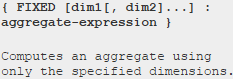

Note:Here is per Building Average Rental Price even the Room is in the views
Building level > Room level
SUM just base on (Fixed Building ), so SUM does not be excuted since ![]() in View(here is on Rows) == Fixed Building, here SUM (here SUM can be replacted with AVG) is row-level
in View(here is on Rows) == Fixed Building, here SUM (here SUM can be replacted with AVG) is row-level
==>SUM base on Room, SUM will not be excuted but values will be replicated==>
SUM just base on (Fixed Building ), so SUM does not be excuted since Building in View(here is on Rows) == Fixed Building, (here SUM can be replacted with AVG)
==>SUM base on Building, but SUM will not be excuted==> SUM(Average Rental Price per Building)
SUM just base on (Fixed Building ), so SUM will be excuted since No Fields in View(here is on Rows) > Fixed Building, here SUM is row-level
==>SUM All will be excuted
AVG(Average Rental Price per Building)
AVG just base on (Fixed Building ), so AVG will be excuted since No Fields in View(here is on Rows) > Fixed Building
==>AVG will be excuted

The following two snippets of code represent a fixed calculation of the average rent for the entire data source (or the subset defined by a context filter):
{FIXED : AVG([Rent])} 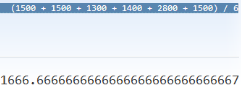 Average the price of all rooms in the dataset
 OR the average rent for the entire data source even the Room is not in the views
 OR
OR
OR the average rent for the entire data source (or the subset defined by a context filter)
{AVG([Rent])} OR
OR OR
OR
OR Marks ==> New Calculation ==> ![]()

INCLUDE
Include level of detail expressions aggregate at the level of detail that's determined by the dimensions in the view, along with the dimensions listed in the code. For example, the following code calculates the average rent at the level of detail that's defined by dimensions in the view, but includes the dimension Room , even if Room is not in the view:https://help.tableau.com/current/pro/desktop/en-us/calculations_calculatedfields_lod.htm

{INCLUDE [Room] : AVG([Rent] ) }Code explaination: AVG Rent Per Room ==>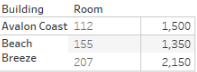
==> Sum All==>1500 + 1350 + 2150 = 5000
==>SUM base on Building level ==>
==>SUM base on Room level ==>
{INCLUDE [Room]: SUM([Rent])} 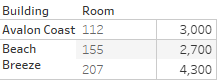 ==> SUM all ==> 3,000 + 2,700 + 4,300 = 10,000
 ==> SUM base on Building==>
==> SUM base on Room==> SUM will not be excuted==>
EXCLUDE
Exclude level of detail expressions aggregate at the level of detail determined by the dimensions in the view, excluding any listed in the code. For example, The following level of detail expression excludes [Region] from a calculation of the sum of [Sales]:
{EXCLUDE [Region]: SUM([Sales])}The expression is saved as [ExcludeRegion].
To illustrate how this expression might be useful, first consider the following view, which breaks out the sum of sales by region and by month:
Dropping [ExcludeRegion] on Color shades the view to show total sales by month but without the regional component:
Level of Detail Expressions - Tableau
Level of detail example
What if you wanted to compare the average rental price for a single room to the overall average rental price for all rooms in the same building?
It's fairly easy to get the average rental price per room: In the preceding view, the view level of detail (level of detail defined by dimensions that are used in the view) is Building and Room because those are the dimensions in the view. So, the average rent is calculated per room per building.
It's also fairly easy to get the average rent per Building by simply removing the Room dimension from the view, as follows:
But what if you want to work with both the average rent per room and average rent per building in the same view? This is where level of detail calculations come into the picture.
There are several ways to approach this solution, but you might consider using an EXCLUDE
level of detail calculation named Average Rent (exclude Room) with code like this:
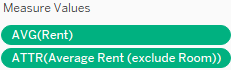
{EXCLUDE [Room] : AVG(Rent) }Then, you can use this in the view that includes Building and Room in the view level of detail to get results like this:
- 1. Place Building, Room on Rows.
- 2. In the data pane, under Measures, double-click each of the following fields: Rent ==>
 , Average Rent (exclude Room). Tableau will place each of these measures in the view by using Measure Names and Measure Values .
 - 3. Rearrange the fields on the Measure Values shelf so that the order is
 :
:

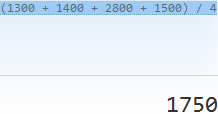
The AVG(Rent) field on the Measure Values shelf is performed at the view level of detail, so we are getting the average rent for every room for every building.
However, the Average Rent (exclude Room) field that's used on measures is calculated excluding the Room dimension, so it is calculated per Building (the only other dimension in the view). Now, we can see that the overall average for Beach Breeze is $1,750, while individual rooms in the building may have been higher or lower.
Parameters
Before moving to some additional examples of row-level and aggregate calculations, let's take a little side trip to examine parameters, given that they can be used in incredible ways in calculations.
A parameter in Tableau is a placeholder for a single, global value such as a number, date, or string. Parameters may be shown as controls (such as sliders, drop-down lists, or type-in text boxes) to end users of dashboards or views, giving them the ability to change the current value of the parameter. The value of a parameter is global so that if the value is changed, every view and calculation in the workbook that references the parameter will use the new value. Parameters provide another way to provide rich interactivity to the end users of your dashboards and visualizations.
Parameters can be used to allow anyone interacting with your view or dashboard to dynamically do many things, including the following:
- Alter the results of a calculation
- Change the size of bins
- Change the number of top or bottom items in a top n filter or top n set
- Set the value of a reference line or band
- Change the size of bins
- Pass values to a custom SQL statement that's used in a data source
Some of these are options we'll consider in later chapters.
Since parameters can be used in calculations, and since calculated fields can be used to define any aspect of a visualization (from filters to colors to rows and columns), the change in a parameter value can have dramatic results. We'll see some examples of this in the following sections.
Creating parameters
Creating a parameter is similar to creating a calculated field.
There are multiple ways to create a parameter in Tableau:
- Use the drop-down menu next to Dimensions in the data pane and select Create Parameter
- Right-click an empty area in the data pane and select Create Parameter
- Use the drop-down menu on a field, set, or parameter in the data pane and select Create | Parameter...
In the last case, Tableau will create a parameter with a list of potential values based on the domain (distinct values) of the field.
- For fields in the data pane that are discrete (blue) by default, Tableau will create a parameter with a list of values matching the discrete values of the field.
- For fields in the data pane that are continuous (green), Tableau will create a parameter with a range set to the minimum and maximum values of the field that's present in the data.
When you first create a parameter (or subsequently edit an existing parameter), Tableau will present an interface like this:
The interface contains the following features:
- 1. The Name will show as the default title for parameter controls and will also be the reference in calculations.
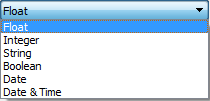
You can also add a Comment to describe the use of the parameter. - 2. The Data Type defines what type of data is allowed for the value of the parameter. Options include integer, float (floating point decimal), string, Boolean, date, or date with time.
- 3. The Current Value defines what the initial default value of the parameter will be. Changing this value in this screen or on a dashboard or visualization where the parameter control is shown will change the current value.
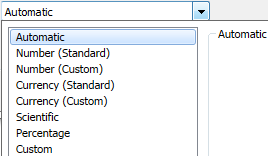
- 4. The Display format defines how the values will be displayed. For example, you might want to show an integer value as a dollar amount, a decimal as a percentage, or display a date in a specific format.
- 5. The Allowable Values option gives us the ability to restrict the scope of values that are permissible. There are three options for Allowable Values:
- All Values allows any input from the user that matches the data type of the parameter.
- List allows us to define a list of values from which the user must select a single option. The list can be entered manually, pasted from the clipboard, or loaded from a dimension of the same data type. Adding from a field is a one-time operation. If the data changes and new values are added, they will not automatically appear in the parameter list.
- Range allows us to define a range of possible values, including an optional upper and lower limit, as well as a step size. This can also be set from a field or another parameter.

- 6. In the preceding screenshot, the List of Values allows us to enter all possible values. In this example,
 a list of three items has been entered. Notice that the value must match the data type, but the display value can be any string value.
This list is static and must be manually updated. Even if you base the parameter on the values that are present in a field, the list will not change, even if new values appear in the data.
You can drag and drop values in the list to reorder the list.
Tip
If you are using a list of options, consider an integer data type with display values that are easily understood by your end users. The values can be easily referenced in calculations to determine what selection was made, and you can easily change the display value without breaking your calculations. This can also lead to increased performance, as comparisons of numeric values are more efficient than string comparisons. However, you'll want to balance the flexibility and performance of integers with readability in calculations. - 7. With allowable values of List or Range, you'll get a series of buttons that allow you to obtain the list of values or range from various sources.
- Add from Parameter copies the list of values or range from an existing parameter;
- Add from Field copies the list of distinct values or range from a field in the data,
- while Paste from Clipboard creates the list of values from anything you have copied to the system clipboard.
- Clear All will clear the list of values.
- Click OK to save changes to the parameter or Cancel to revert.
When the parameter is created, it appears in the data pane under the Parameters section. The drop-down menu for a parameter reveals an option, Show Parameter Control, which adds the parameter control to the view. The little drop-down caret in the upper right of the parameter control reveals a menu for customizing the appearance and behavior of the parameter control. Here is the parameter control, shown as a single value list, for the parameter we created earlier: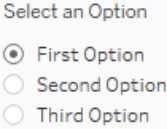
This control can be shown on any sheet or dashboard and allows the end user to select a single value. When the value is changed, any calculations, filters, sets, or bins that use the parameter will be reevaluated, and any views that are affected will be redrawn.
Practical examples of calculations and parameters
Let's turn our attention to some practical examples of calculations. These will be examples of row-level and aggregate-level calculations. These are merely examples. The goal is to learn and understand some of what is possible with calculations. You will be able to build on these examples as you embark[ɪmˈbɑːrk on从事 ; 着手 ; 开始 your analysis and visualization journey.
A great place to find help and suggestions for calculations is the official Tableau forums at Tableau Community Forums
Fixing data issues
Often, data is not entirely clean. That is, it has problems that need to be corrected before meaningful analysis can be accomplished. For example, dates may be incorrectly formatted or fields may contain a mix of numeric values and character codes that need to be separated into multiple fields. Calculated fields can often be used to fix these kinds of issues.
We'll continue working with the Vacation Rentals data. You'll recall that the start and end dates looked something like this:
Without the year, Tableau does not recognize the Start or End fields as dates. Instead, Tableau recognizes them as strings. You might try using the drop-down menu on the fields in the data pane to change the data type to date, but without the year, Tableau will almost certainly parse them incorrectly, or at least, incompletely. This is a case where we'll need to use a calculation to fix the issue.
Assuming, in this case, that you are confident the year should always be 2018, you might create calculated fields named Start Date and End Date. Here is the code for getting the start date:
DATE([Start] + ", 2018")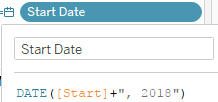
And here is the code for getting the end date:
DATE([End] + ", 2018")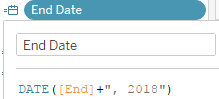
What these calculated fields do is concatenate the month and day with the year and then use the DATE() function to convert the string into a date value. Indeed, Tableau recognizes the resulting fields as dates (with all the features of a date field, such as built-in hierarchies). A quick check in Tableau reveals the expected results:
Extending the data
Often, there will be dimensions or measures you'd like to have in your data, but which are not present in the source. Many times, you will be able to extend your dataset using calculated fields. We already considered an example of creating a field for the full name of the guest where we only had first and last name fields.
Additionally, one thing that might unlock some interesting analysis, is to calculate the length of each rental. We have the start and end dates, but not the length of time between those two dates. Fortunately, this is easy to calculate.
Create a calculated field named Days Rented with the following code:
DATEDIFF('day', [Start Date], [End Date])  The DATEDIFF() function takes a date part description, a start and an end date, and returns a numeric value for the difference between the two dates.
Tip
Tableau employs intelligent code completion. It will offer suggestions for functions and field names as you type in the code editor. Pressing the Tab key will autocomplete what you have started to type based on the current suggestion.
We now have a new measure, which wasn't available previously. We can use this new measure in our visualizations, such as the Gantt chart of rentals, as follows:
The chart allows us to instantly understand how long each guest stayed, when the rooms were occupied, and when the rooms were vacant[ˈveɪkənt](地方)空着的.
Enhancing user experience, analysis, and visualizations
Calculations and parameters can greatly enhance the user experience, the analysis, and the visualizations.
Let's say we want to give the vacation condo manager the ability to do some what-if analysis. Every year, she offers a free night during the month of December. She wants to be able to see which rentals would have received the free night, depending on which night she chooses.
To accomplish this, follow these steps:
- 1. If you have not done so, create the Gantt chart that was shown earlier.
- 2. Create a parameter called Free Night with a data type of Date and a starting value of 12/12/2018( as the default date of the free night ).
 This will allow the manager to set and adjust the starting date for the promotional month. Show the parameter control on the view by selecting Show Parameter Control from the drop-down menu on the parameter in the data pane.
- 3. Now, add a reference line to the view to show the free night. Do this by switching to the Analytics tab in the left sidebar. Drag Reference Line to the view and drop it on Table:
the resulting dialog box, set the Line Value to Free Night. You may wish to set 4.
the Label to None or Custom with the text Free Night. You may also wish to
adjust the formatting of the line:
- 4. In the resulting dialog box, set the Line Value to Free Night. You may wish to set the Label to None or Custom with the text Free Night. You may also wish to adjust the formatting of the line:

- 5. Create a calculated field called Gets Free Night that returns a true or false value, depending on whether the free night falls within the rental period:
[Free Night] >= [Start Date]
AND
[Free Night] <= [End Date]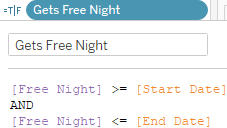
-
6. Place this new calculated field on the Color shelf.
We now have a view that allows the apartment manager to change the date and see a dynamically changing view that makes it obvious which renters would have fallen within a given promotional period. Experiment by changing the value of the Promotional Month Start parameter to see how the view updates:
The preceding view shows the proposed free night as a dashed line and highlights which rental periods would receive a free night. The line and colors will change as the apartment manager adjusts the Free Night parameter value.
Ad hoc calculations临时计算
Ad hoc calculations allow you to add calculated fields to shelves in a single view without adding fields to the data pane.
Let's say you have a simple view that shows the Rent per Guest , like this:
What if you wanted to quickly highlight any renters who had paid less than $1,450? One option would be to create an ad hoc calculation. To do so, simply double-click on an empty area of the Columns, Rows, or Measure Values cards, or on the empty space of the Marks shelf, and then start typing the code for a calculation. In this example, we've double-clicked the empty space on the Marks shelf:

Here, we've entered code that will return True if the sum of Rent is less than $1,450 and False otherwise. Pressing Enter or clicking outside the text box will reveal a new ad hoc field that can be dragged and dropped anywhere within the view. Here, we've added it to the Color shelf:
The ad hoc field is only available within the view and does not show up in the data pane. You can double-click the field to edit the code.
Tip
Dragging and dropping an ad hoc field into the data pane transforms it into a regular calculated field that will be available for other views that are using that data source.
Performance considerations
When working with a small dataset and an efficient database, you often won't notice inefficient calculations. With larger datasets, the efficiency of your calculations can start to make a fairly dramatic difference to the speed at which a view is rendered.
Here are some tips for making your calculations as efficient as possible:
- Boolean and numeric calculations are faster than string calculations. If possible, avoid string manipulation and use aliasing or formatting to provide user friendly labels.
For example, don't write the following code: IF [value] == 1 THEN "Yes" ELSE "No" END. Instead, simply write [value] == 1 , and then edit the aliases of the field and set True to Yes and False to No . - Always look for ways to increase the efficiency of a calculation. If you find yourself writing a long IF ELSEIF statement with lots of conditions, see whether there are one or two conditions that you can check first to eliminate the checks of all the other conditions.
For example, let's consider simplifying the following code:
The preceding code snippet can also be written like this:IF [Type] = "Dog" AND [Age] < 1 THEN "Puppy" ELSEIF [Type] = "Cat" AND [Age] < 1 THEN "Kitten" ENDIF [Age] < 1 THEN IF [Type] = "Dog" THEN "Puppy" ELSEIF [Type] = "Cat" THEN "Kitten" END END
Notice how the check of type doesn't have to be done for any records where the age was
less than 1. That could be a very high percentage of records in the dataset.
Row-level calculations have to be performed for every row of data. Try to minimize the complexity of row-level calculations. However, if that is not possible or doesn't solve a performance issue, consider the final option.
When you create a data extract, certain row-level calculations are materialized. This means that the calculation is performed one time, when the extract is created, and the results are then stored in the extract. This means that the data engine does not have to execute the calculation over and over. Instead, the value is simply read from the extract. Calculations that use any user functions or parameters, or TODAY() or NOW() , will not be materialized in an extract as the value necessarily changes according to the current user, parameter selection, and system time. Tableau's optimizer may also determine whether or not to materialize certain calculations that are more efficiently performed in memory rather than having to read the stored value.
Tip
When you use an extract to materialize row-level calculations, only the calculations that were created at the time of the extract are materialized. If you edit calculated fields or create new ones after creating the extract, you will need to optimize the extract (use the drop-down menu on the data source or select it from the Data menu and then select Extract | Optimize).
Summary
Calculations open up amazing possibilities in Tableau. You are no longer confined to the fields in the source data. With calculations, you can extend the data by adding new dimensions and measures, fix bad or poorly formatted data, and enhance the user experience with parameters for user input and calculations that enhance the visualizations.
The key to using calculated fields is understanding the four main types of calculations in Tableau.
- Row-level calculations are performed for every row of source data. These calculated fields can be used as dimensions or they can be aggregated as measures.
- Aggregate-level calculations are performed at the level of detail that's defined by the dimensions that are present in a view. They are especially helpful, and even necessary, when you must first aggregate components of the calculation before performing additional operations.
- Level of detail calculations allow you to define the level of detail at which
- aggregations are performed and
- then work with the results at a row level.
In the next chapter, we'll explore the final main type of calculations: table calculations. These are some of the most powerful calculations in terms of their ability to solve problems and open up incredible possibilities for in-depth analysis. In practice, they range from very easy to exceptionally complex.


 3万+
3万+


 被折叠的 条评论
为什么被折叠?
被折叠的 条评论
为什么被折叠?
 到【灌水乐园】发言


