


上上一章【循环神经网络】(上)的代码改进:
举例:seq-》seq序列到序列 ”hello“-》”ohlol“
一、模型:
采用以下网络结构
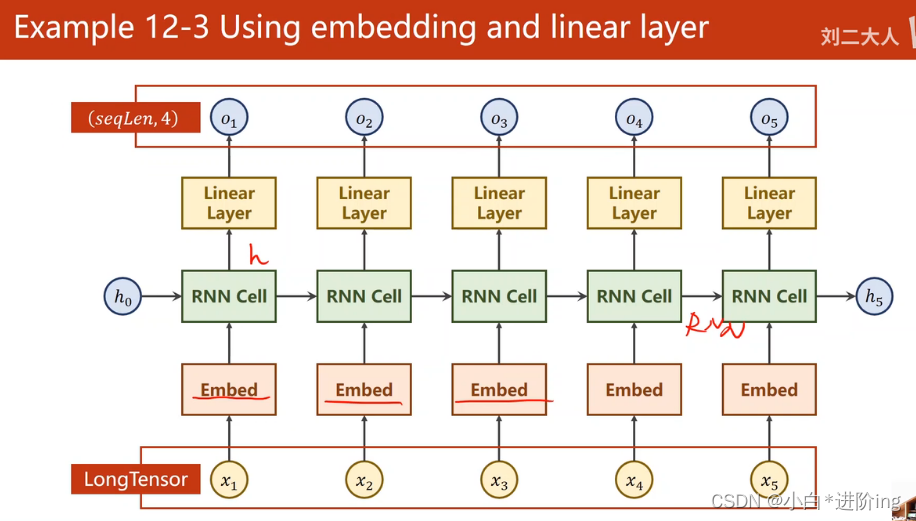
第一层EMBEDDING层
上一章讲过词向量和独热向量区别
torch.nn.Embedding函数参数

num_embedding 上一章中Q矩阵的高度 embedding_dim 宽度
input_size, embedding_size在上一个例题中
self.emb = torch.nn.Embedding(input_size(num_embedding 上一章中Q矩阵的高度 ), embedding_size(embedding_dim 宽度))
第二层RNN层
torch.nn.RNN(input_size=embedding_size,
hidden_size=hidden_size,
num_layers=num_layers,
batch_first=True)
batch_first=True使得
input.shape=(seq_len,batch_size,input_size)
output.shape=(seq_len,batch_size,hidden_size) 变为
input.shape=(batch_size,seq_len,input_size)
output.shape=(batch_size,seq_len,input_size)
第三层全连接层
torch.nn.Linear(hidden_size, num_class)
num_class分类问题中分类个数 本题就是4分类
代码
import torch
import matplotlib.pyplot as plt

num_class = 4
input_size = 4
hidden_size = 8
embedding_size = 10
num_layers = 2
batch_size = 1
seq_len = 5


idx2char = ['e', 'h', 'l', 'o']
x_data = [[1, 0, 2, 2, 3]] # (batch, seq_len)
y_data = [3, 1, 2, 3, 2] # (batch * seq_len)
# b,s
# print(x_data.shape,y_data.shape)
inputs = torch.LongTensor(x_data)
labels = torch.LongTensor(y_data)
# print(inputs.shape,labels.shape)=torch.Size([1, 5]) torch.Size([5])


class Model(torch.nn.Module):
    def __init__(self):
        super(Model, self).__init__()
        self.emb = torch.nn.Embedding(input_size, embedding_size)
        self.rnn = torch.nn.RNN(input_size=embedding_size,
                                hidden_size=hidden_size,
                                num_layers=num_layers,
                                batch_first=True)
        self.fc = torch.nn.Linear(hidden_size, num_class)

    def forward(self, x):
        hidden = torch.zeros(num_layers, x.size(0), hidden_size)
        # print(x,x.shape)=tensor([[1, 0, 2, 2, 3]]) torch.Size([1, 5])
        # embedding前要torch.LongTensor(x_data)=torch.Size([1, 5])b,s
        x = self.emb(x)
        # 经过embedding变成 torch.Size([1, 5, 10]) b,s,e
        print(x,x.shape)
        x, _ = self.rnn(x, hidden)
        x = self.fc(x)
        return x.view(-1, num_class)


net = Model()
criterion = torch.nn.CrossEntropyLoss()
# lr=0.05损失反而会增大
optimizer = torch.optim.Adam(net.parameters(), lr=0.1)

loss_list = []
epoch_list = []

for epoch in range(15):
    optimizer.zero_grad()
    outputs = net(inputs)
    loss = criterion(outputs, labels)
    epoch_list.append(epoch)
    loss_list.append(loss.item())
    loss.backward()
    optimizer.step()

    _, idx = outputs.max(dim=1)
    idx = idx.data.numpy()
    print('Predicted: ', ''.join([idx2char[x] for x in idx]), end='')
    print(', Epoch [%d/15] loss = %.3f' % (epoch+1, loss.item()))

plt.plot(epoch_list, loss_list)
plt.xlabel("Epoch")
plt.ylabel("Loss")
plt.show()


 450
450


 被折叠的 条评论
为什么被折叠?
被折叠的 条评论
为什么被折叠?
 到【灌水乐园】发言


