


作业
1)查阅matplotlib官网,列举出Sequential,Diverging,Cyclic,Qualitative,Miscellaneous分别有哪些内置的colormap,并以代码绘图的形式展现出来
import numpy as np
import matplotlib as mpl
import matplotlib.pyplot as plt
from matplotlib import cm
from colorspacious import cspace_converter
cmaps = {}

gradient = np.linspace(0, 1, 256)
gradient = np.vstack((gradient, gradient))


def plot_color_gradients(category, cmap_list):
    # Create figure and adjust figure height to number of colormaps
    nrows = len(cmap_list)
    figh = 0.35 + 0.15 + (nrows + (nrows - 1) * 0.1) * 0.22
    fig, axs = plt.subplots(nrows=nrows + 1, figsize=(6.4, figh))
    fig.subplots_adjust(top=1 - 0.35 / figh, bottom=0.15 / figh,
                        left=0.2, right=0.99)
    axs[0].set_title(f'{category} colormaps', fontsize=14)

    for ax, name in zip(axs, cmap_list):
        ax.imshow(gradient, aspect='auto', cmap=plt.get_cmap(name))
        ax.text(-0.01, 0.5, name, va='center', ha='right', fontsize=10,
                transform=ax.transAxes)

    # Turn off *all* ticks & spines, not just the ones with colormaps.
    for ax in axs:
        ax.set_axis_off()

    # Save colormap list for later.
    cmaps[category] = cmap_list
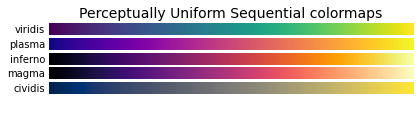
Sequential包括的内置colormap
plot_color_gradients('Perceptually Uniform Sequential',
                     ['viridis', 'plasma', 'inferno', 'magma', 'cividis'])
plot_color_gradients('Sequential',
                     ['Greys', 'Purples', 'Blues', 'Greens', 'Oranges', 'Reds',
                      'YlOrBr', 'YlOrRd', 'OrRd', 'PuRd', 'RdPu', 'BuPu',
                      'GnBu', 'PuBu', 'YlGnBu', 'PuBuGn', 'BuGn', 'YlGn'])

plot_color_gradients('Sequential (2)',
                     ['binary', 'gist_yarg', 'gist_gray', 'gray', 'bone',
                      'pink', 'spring', 'summer', 'autumn', 'winter', 'cool',
                      'Wistia', 'hot', 'afmhot', 'gist_heat', 'copper'])

Diverging
plot_color_gradients('Diverging',
                     ['PiYG', 'PRGn', 'BrBG', 'PuOr', 'RdGy', 'RdBu', 'RdYlBu',
                      'RdYlGn', 'Spectral', 'coolwarm', 'bwr', 'seismic'])
![[外链图片转存失败,源站可能有防盗链机制,建议将图片保存下来直接上传(img-2bWuwKl6-1640537027459)(output_8_0.png)]](https://img-blog.csdnimg.cn/ef2ff4d31bc84eb7a5f8b4e50233391b.png?x-oss-process=image/watermark,type_d3F5LXplbmhlaQ,shadow_50,text_Q1NETiBAbG9uZyBSb29raWU=,size_12,color_FFFFFF,t_70,g_se,x_16)
Cyclic
plot_color_gradients('Cyclic', ['twilight', 'twilight_shifted', 'hsv'])
![[外链图片转存失败,源站可能有防盗链机制,建议将图片保存下来直接上传(img-VrFXymcx-1640537027460)(output_10_0.png)]](https://img-blog.csdnimg.cn/d2137bb07d144cddafb4bd2fef60bd30.png)
Qualitative
plot_color_gradients('Qualitative',
                     ['Pastel1', 'Pastel2', 'Paired', 'Accent', 'Dark2',
                      'Set1', 'Set2', 'Set3', 'tab10', 'tab20', 'tab20b',
                      'tab20c'])
![[外链图片转存失败,源站可能有防盗链机制,建议将图片保存下来直接上传(img-zbVqcCTO-1640537027460)(output_12_0.png)]](https://img-blog.csdnimg.cn/24f403d7e9a24a8f8d58b4c88d70702d.png?x-oss-process=image/watermark,type_d3F5LXplbmhlaQ,shadow_50,text_Q1NETiBAbG9uZyBSb29raWU=,size_11,color_FFFFFF,t_70,g_se,x_16)
Miscellaneous
plot_color_gradients('Miscellaneous',
                     ['flag', 'prism', 'ocean', 'gist_earth', 'terrain',
                      'gist_stern', 'gnuplot', 'gnuplot2', 'CMRmap',
                      'cubehelix', 'brg', 'gist_rainbow', 'rainbow', 'jet',
                      'turbo', 'nipy_spectral', 'gist_ncar'])

plt.show()
![[外链图片转存失败,源站可能有防盗链机制,建议将图片保存下来直接上传(img-WudsNOum-1640537027461)(output_14_0.png)]](https://img-blog.csdnimg.cn/ccfd25619af343f7a45aaf5565c0913a.png?x-oss-process=image/watermark,type_d3F5LXplbmhlaQ,shadow_50,text_Q1NETiBAbG9uZyBSb29raWU=,size_12,color_FFFFFF,t_70,g_se,x_16)
2)学习如何自定义colormap,并将其应用到任意一个数据集中,绘制一幅图像,注意colormap的类型要和数据集的特性相匹配,并做简单解释
from sklearn.datasets import load_iris
iris = load_iris()
# iris的标签为三个,对应不同的颜色,使用Qualitative的tab20b colormap内置类型
plt.scatter(x=iris.data[:,0], y=iris.data[:,1], c=iris.target, cmap='tab20b')
plt.show()
![[外链图片转存失败,源站可能有防盗链机制,建议将图片保存下来直接上传(img-mrIOXcZP-1640537027462)(output_15_0.png)]](https://img-blog.csdnimg.cn/cc6033764f6240c1bea30ac218bae0ac.png?x-oss-process=image/watermark,type_d3F5LXplbmhlaQ,shadow_50,text_Q1NETiBAbG9uZyBSb29raWU=,size_10,color_FFFFFF,t_70,g_se,x_16)


 4万+
4万+


 被折叠的 条评论
为什么被折叠?
被折叠的 条评论
为什么被折叠?
 到【灌水乐园】发言


