


Heatmap 热力图(1)
显示多个对象,单个属性之间的关系的时候,用柱状图就可以直观的比较;当需要比较多个对象多个属性之间的差异时,需要用热力图。
基于R的heatmaply和plotly交互式热力图
- 安装:
>install.packages(“heatmaply”)
package ‘assertthat’ successfully unpacked and MD5 sums checked
package ‘DBI’ successfully unpacked and MD5 sums checked
package ‘BH’ successfully unpacked and MD5 sums checked
package ‘dplyr’ successfully unpacked and MD5 sums checked
package ‘lazyeval’ successfully unpacked and MD5 sums checked
package ‘colorspace’ successfully unpacked and MD5 sums checked
package ‘tidyr’ successfully unpacked and MD5 sums checked
package ‘plyr’ successfully unpacked and MD5 sums checked
package ‘hexbin’ successfully unpacked and MD5 sums checked
package ‘gridExtra’ successfully unpacked and MD5 sums checked
package ‘gtable’ successfully unpacked and MD5 sums checked
package ‘RColorBrewer’ successfully unpacked and MD5 sums checked
package ‘dichromat’ successfully unpacked and MD5 sums checked
package ‘munsell’ successfully unpacked and MD5 sums checked
package ‘labeling’ successfully unpacked and MD5 sums checked
package ‘plotly’ successfully unpacked and MD5 sums checked
package ‘viridis’ successfully unpacked and MD5 sums checked
package ‘ggplot2’ successfully unpacked and MD5 sums checked
package ‘dendextend’ successfully unpacked and MD5 sums checked
package ‘reshape2’ successfully unpacked and MD5 sums checked
package ‘scales’ successfully unpacked and MD5 sums checked
package ‘heatmaply’ successfully unpacked and MD5 sums checked

The downloaded binary packages are in
    C:\Users\zang\AppData\Local\Temp\Rtmp21nHj7\downloaded_packages
等待安装完成,在安装过程中会下载示例数据,时间有点长。
- 显示示例数据
> library(heatmaply)
载入需要的程辑包:plotly
载入需要的程辑包:ggplot2
载入程辑包:‘plotly’
The following object is masked from ‘package:ggplot2’:
    last_plot
The following object is masked from ‘package:graphics’:
    layout
载入需要的程辑包:viridis
---------------------
Welcome to heatmaply version 0.3.2
Type ?heatmaply for the main documentation.
The github page is: https://github.com/talgalili/heatmaply/
Suggestions and bug-reports can be submitted at: https://github.com/talgalili/heatmaply/issues
Or contact: <tal.galili@gmail.com>
    To suppress this message use:  suppressPackageStartupMessages(library(heatmaply))
---------------------
Warning messages:
1: 程辑包‘heatmaply’是用R版本3.2.5 来建造的
2: 程辑包‘plotly’是用R版本3.2.5 来建造的
3: 程辑包‘ggplot2’是用R版本3.2.5 来建造的
4: 程辑包‘viridis’是用R版本3.2.5 来建造的
>heatmaply(mtcars, k_col = 2, k_row = 3) %>% layout(margin = list(l = 130, b = 40))
初步结果:
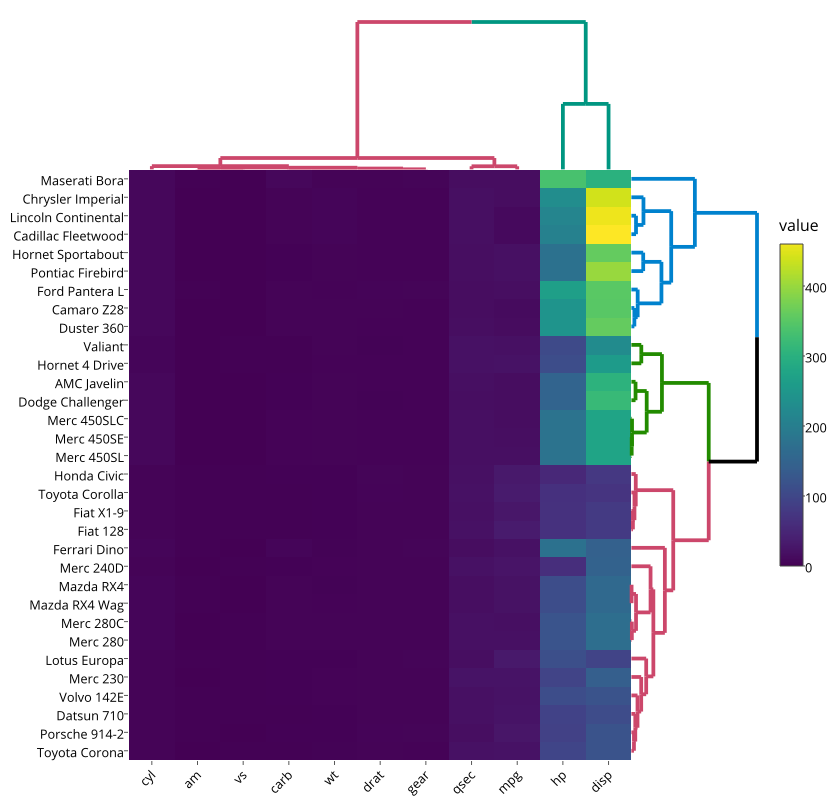
Pipe操作连接margin函数以调整显示尺寸:
>heatmaply(cor(mtcars), k_col = 2, k_row = 2,limits = c(-1,1)) %>% layout(margin = list(l =40, b = 40),colors = heat.colors(100))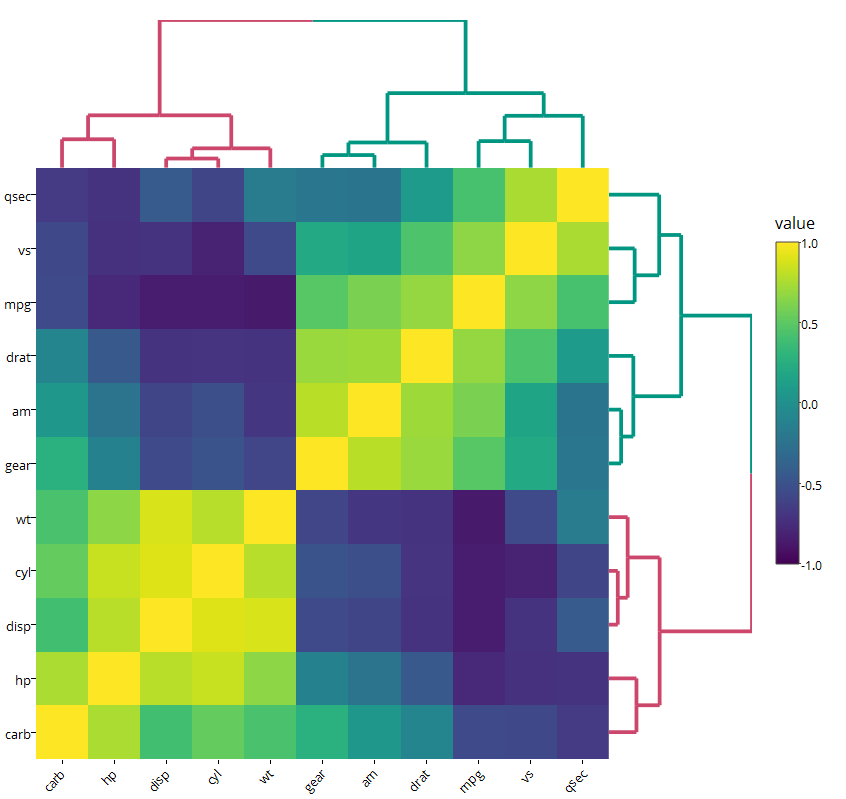
插入相关系数函数作为热力数值,limits作为显示范围从负相关到正相关.colors函数用以调整色彩,其他命令如下:
>heatmaply(cor(mtcars),scale_fill_gradient_fun = ggplot2::scale_fill_gradient2(low = "blue",high = "red", midpoint = 5, limits = c(-1, 1)),k_col = 2, k_row = 3) %>% layout(margin =list(l = 100, b = 100))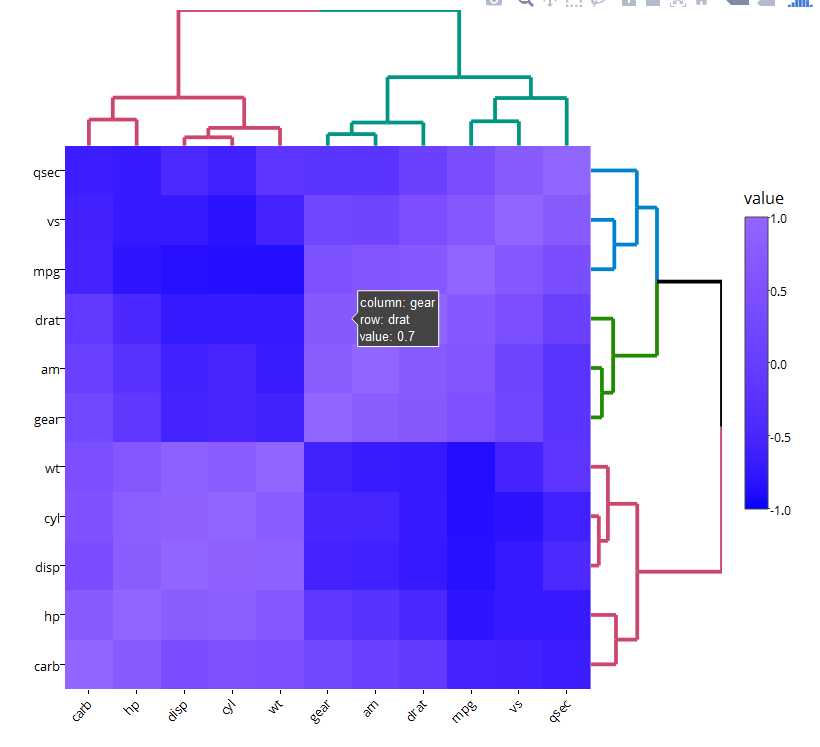
完成。


 3954
3954


 被折叠的 条评论
为什么被折叠?
被折叠的 条评论
为什么被折叠?
 到【灌水乐园】发言


