


论文全名:D-MHGCN: An End-to-End Individual Behavioral Prediction Model Using Dual Multi-Hop Graph Convolutional Network
英文是纯手打的!论文原文的summarizing and paraphrasing。可能会出现难以避免的拼写错误和语法错误,若有发现欢迎评论指正!文章偏向于笔记,谨慎食用
目录
3.3.1. Individual Cortical Graph Construction
3.3.2. Individual Functional Connectivity Network Construction
3.3.3. Individual Behavior Score Estimation
3.5. Experimental Results and Analysis
3.5.2. Comparison With State-of-The-Art Methods
3.5.3. Effectiveness of the Proposed Behavioral Prediction Framework
3.5.4. Effectiveness of Multi-Hop Graph Convolutional Operator
3.5.5. Analysis of Individual Cortical Parcellation
3.5.6. Discussion of Future Clinical Applications
1. 重复点
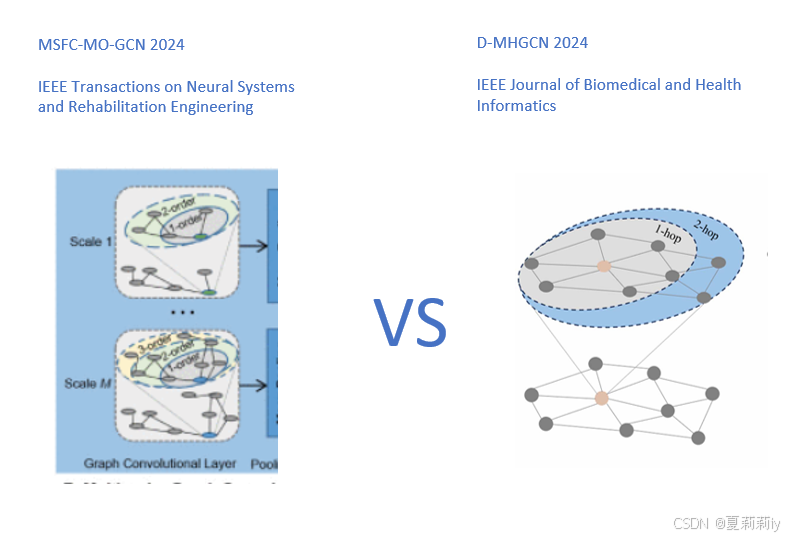
①此篇论文D-MHGCN与Multi-Scale FC-Based Multi-Order GCN: A Novel Model for Predicting Individual Behavior From fMRI的图非常相似
②虽然都是同样的导师和学生
③MSFC-MO-GCN我的笔记:[论文精读]Multi-Scale FC-Based Multi-Order GCN: A Novel Model for Predicting Individual Behavior From --CSDN博客
④相似点1:

⑤相似点2:
⑥仁者见仁智者见智好吧?
2. 心得
(1)
3. 论文逐段精读
3.1. Abstract
①Existing problem: ignores the upstream network construction
②They proposed Dual Multi-Hop Graph Convolutional Network (D-MHGCN)
3.2. Introduction
①Functional connectivity (FC) based methods are affected by: a) the quality of FC, b) the feature extraction ability in FC
3.3. Methodology
①The overall framework:
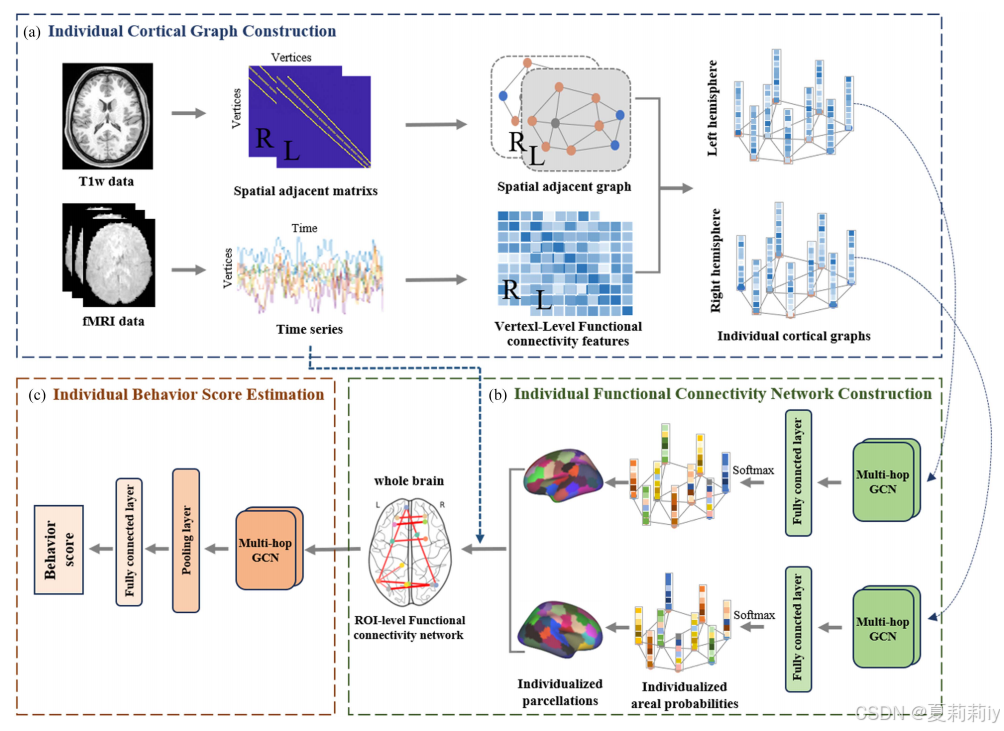
3.3.1. Individual Cortical Graph Construction
①The graph is represented by , where
denotes the cortical vertices of the brain,
is the spatial proximity of vertices in T1w images,
is FC matrix come from fMRI data
②Cortical parcellation separately applied on two brain hemispheres
③Connectivity weight in : the inverse of their geometric distance. "邻接矩阵A^C中的边表示两个顶点是否在皮质表面共享一个三角形区域"(0.0我怎么知道共享不共享?作者后来又说“该图显示了稀疏但高度局部化的空间连接,其中每个顶点平均连接到大约六个最近的邻居”)
④ and
⑤Construction of FC: Pearson correlation between BOLD signals, all the negative value is set to 0, and only remains the connections which the spatial distance was less than 1
3.3.2. Individual Functional Connectivity Network Construction
(1)Problem Statement
①For subject, the cortical graph is
,
denotes vertex set,
represents adjacency matrix,
is FC matrix
②The region level is generated by
and fMRI time series
(2)Multi-Hop Graph Convolutional Network
①Backbone: GCN
②Multi-hop aggregation method:
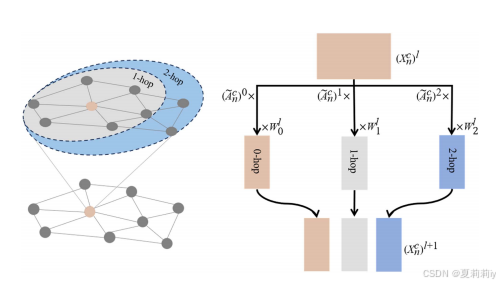
they defined the hop set
③The node feature matrix in the -th layer:
④Multi-hop convolution:
where ,
denotes ReLU activation function
⑤The final node feature is represented by:
where denotes the trainable parameters
⑥Classifier: SoftMax
toy example 简单的示例
(3)Individual Cortical Parcellation
①Atlas: Schaefer-100 atlas and the Human Brainnetome Atlas (BNA)
②By mapping to the standard space, they got the label vector for each vertex
③Employed cross-entropy loss to calculate the difference between the actual regional labels
(from group-level template) and the predicted regional probabilities
(obtained from multi-hop GCN) with:
where denotes the number of regions in predefined group-level template(怎么给到的每个顶点预测概率?),
denotes the probability that node
belongs to region
,
is whether node
is in region
in the templet
④ in Schaefer and BNA is 50 and 106
(4)Individual Functional Connectivity Estimation
①The region level FCN:
②Dividing the brain of each subject to regions and calculating the PC of each region with all negative values are 0. The generated FC is regarded as the
in
3.3.3. Individual Behavior Score Estimation
(1)Multi-Hop Graph Convolutional Layer
①The FC feature in the -th layer:
②The FC conv layer:
where
(2)Pooling Layer
①Aggregation to get feature vector for each subject:
...就是一个平均池化嘛
(3)Behavior Score Assessment
①The scores are calculated by fully connected layer:
where denotes the trainable parameters
②Measurements: MAE:
where is the groud truth and
denotes the predicted score
3.3.4. Total Loss
①The total loss:
3.4. Experimental Settings
3.4.1. Dataset
(1)Data Information
①Dataset: HCP S1200
②State of subjects: awaken, eyes open and staring a bright crosshair projected against a dark background
③Sample: 910
(2)Imaging Data Preprocessing
①Preprocessing of sMRI: 1) distortion correction, 2) alignment of T1w and T2w images, 3) bias field correction, 4) cortical tissue segmentation (gray matter, white matter, and cerebrospinal fluid), and 5) cortical reconstruction, 6) resampling
②Tool: FreeSurfer
③Preprocessing of fMRI: 1) gradient distortion correction, 2) head motion correction, 3) EPI distortion correction, 4) registration to Montreal Neurological Institute (MNI) space, 5) intensity normalization to the global mean, and 6) removal of non-brain voxels, 7) mapping, 8) resampling
(3)Behavioral Scores
①Cognitive tests: executive function-related test (Cognitive Flexibility), languagerelated test (Story Difficulty Level), and comprehensive cognitive test (Fluid Intelligence)
②Evaluation methods: NIH Toolbox
3.4.2. Implementation Details
①Learning rate: 0.005
②Optimizer: Adam
③L2 Norm: coefficient of 5e–5
④Epoch: pretraining 30 for individual functional connectivity network construction, and train individual behavior score estimation 30 rounds. Lastly, jointly train they two with 20 rounds
⑤Layers of NN: 7, {32,64,50,32,64,64,1} in Schaefer100 and {32,64,106,32,64,64,1} in BNA
3.4.3. Evaluation Metrics
(1)Behavioral Prediction
①Evaluation method: "The accuracy of behavioral prediction was evaluated by calculating the Pearson correlation between the actual behavior scores and the assessed behavior scores. The range of correlation is from −1 to 1, with higher values indicating a better behavioral prediction result."
(2)Cortical Parcellation Quality
①Evaluation: Silhouette Width:
where denotes the average FC among nodes within the parcel
,
is the average FC of nodes in parcel
cross parcels
3.5. Experimental Results and Analysis
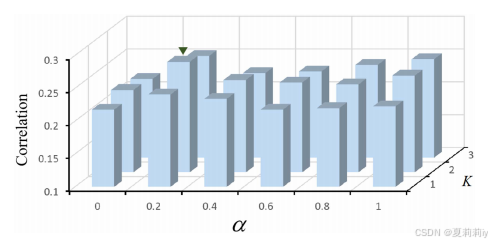
3.5.1. Parameter Analysis
①Parameter ablation on 5 fold cross validation:
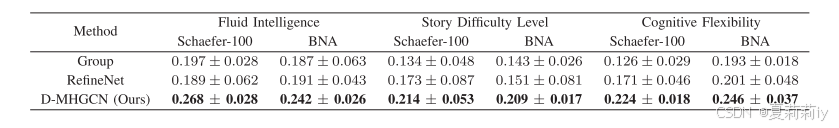
3.5.2. Comparison With State-of-The-Art Methods
(1)Behavioral Prediction Accuarcy
①Performance table:
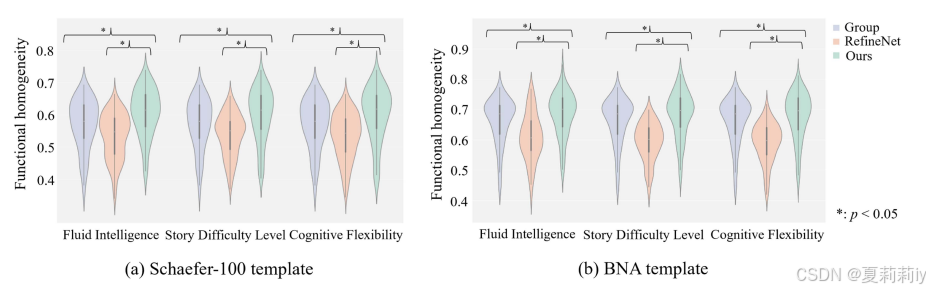
(2)Individual Cortical Parcellation Quality
①Sample: 910 subjects with 728 for training and 182 for testing
②Comparison figures:
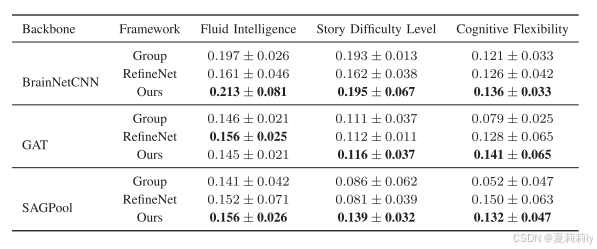
3.5.3. Effectiveness of the Proposed Behavioral Prediction Framework
①Module ablation:
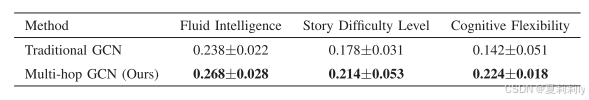
3.5.4. Effectiveness of Multi-Hop Graph Convolutional Operator
①Hop ablation:
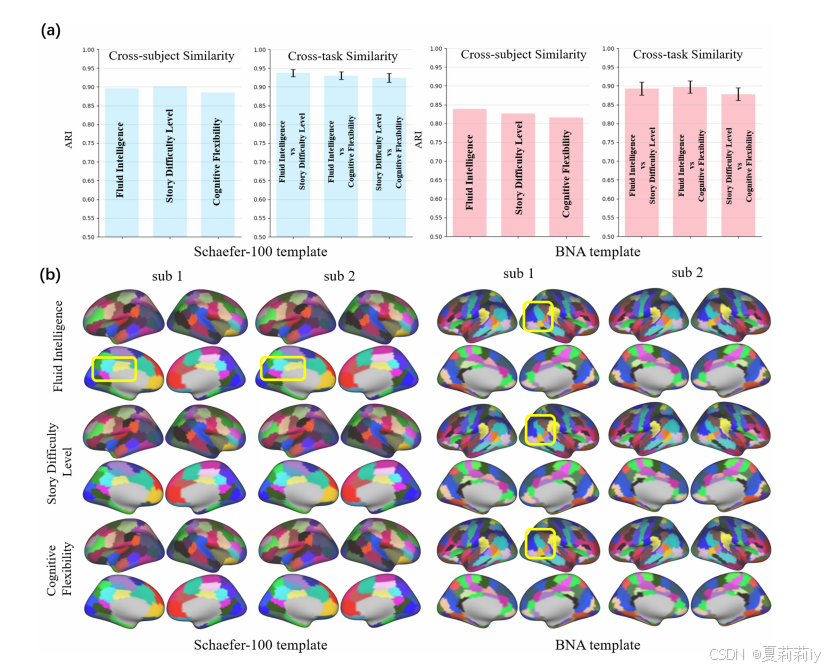
3.5.5. Analysis of Individual Cortical Parcellation
①Analysis of individual cortical parcellation:
3.5.6. Discussion of Future Clinical Applications
①Personalized cortical segmentation map is important
3.6. Conclusion
~
5. Reference
Wen, X. et al. (2024) 'D-MHGCN: An End-to-End Individual Behavioral Prediction Model Using Dual Multi-Hop Graph Convolutional Network', IEEE Journal of Biomedical and Health Informatics, 28(10): 6130-6140. doi: 10.1109/JBHI.2024.3420134


 被折叠的 条评论
为什么被折叠?
被折叠的 条评论
为什么被折叠?
 到【灌水乐园】发言


