


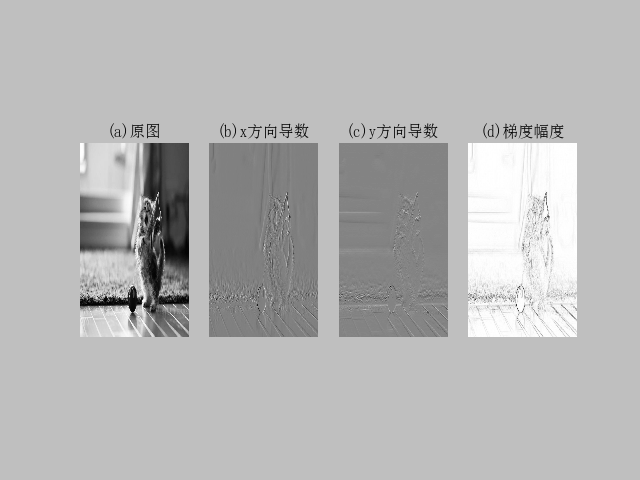
图像导数:
# -*- coding: utf-8 -*-
from PIL import Image
from pylab import *
from scipy.ndimage import filters
import numpy

# 添加中文字体支持
from matplotlib.font_manager import FontProperties
font = FontProperties(fname=r"c:\windows\fonts\SimSun.ttc", size=14)

im = array(Image.open('C:/avg/avg2.jpg').convert('L'))
gray()

subplot(1, 4, 1)
axis('off')
title(u'(a)原图', fontproperties=font)
imshow(im)

# Sobel derivative filters
imx = zeros(im.shape)
filters.sobel(im, 1, imx)
subplot(1, 4, 2)
axis('off')
title(u'(b)x方向导数', fontproperties=font)
imshow(imx)

imy = zeros(im.shape)
filters.sobel(im, 0, imy)
subplot(1, 4, 3)
axis('off')
title(u'(c)y方向导数', fontproperties=font)
imshow(imy)

#mag = numpy.sqrt(imx**2 + imy**2)
mag = 255-numpy.sqrt(imx**2 + imy**2)
subplot(1, 4, 4)
title(u'(d)梯度幅度', fontproperties=font)
axis('off')
imshow(mag)

show()
 # -*- coding: utf-8 -*-
from PIL import Image
from pylab import *
from scipy.ndimage import filters
import numpy
'''
高斯差分
'''

# 添加中文字体支持
#from matplotlib.font_manager import FontProperties
#font = FontProperties(fname=r"c:\windows\fonts\SimSun.ttc", size=14)

def imx(im, sigma):
    imgx = zeros(im.shape)
    filters.gaussian_filter(im, sigma, (0, 1), imgx)
    return imgx


def imy(im, sigma):
    imgy = zeros(im.shape)
    filters.gaussian_filter(im, sigma, (1, 0), imgy)
    return imgy


def mag(im, sigma):
    # there's also gaussian_gradient_magnitude()
    #mag = numpy.sqrt(imgx**2 + imgy**2)
    imgmag = 255 - numpy.sqrt(imgx ** 2 + imgy ** 2)
    return imgmag


im = array(Image.open('C:/avg/avg2.jpg').convert('L'))
figure()
gray()

sigma = [2, 5, 10]

for i in  sigma:
    subplot(3, 4, 4*(sigma.index(i))+1)
    axis('off')
    imshow(im)
    imgx=imx(im, i)
    subplot(3, 4, 4*(sigma.index(i))+2)
    axis('off')
    imshow(imgx)
    imgy=imy(im, i)
    subplot(3, 4, 4*(sigma.index(i))+3)
    axis('off')
    imshow(imgy)
    imgmag=mag(im, i)
    subplot(3, 4, 4*(sigma.index(i))+4)
    axis('off')
    imshow(imgmag)

show()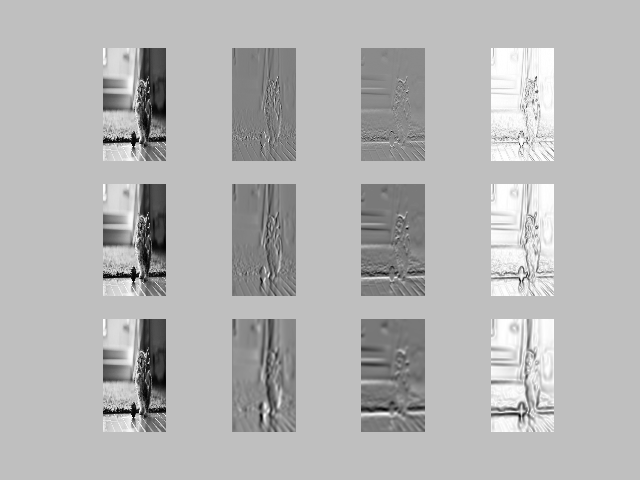
第一行标准差为2,列分别表示的是x、y和mag,第二行和第三行依次类推。


 2662
2662

 被折叠的 条评论
为什么被折叠?
被折叠的 条评论
为什么被折叠?
 到【灌水乐园】发言


