


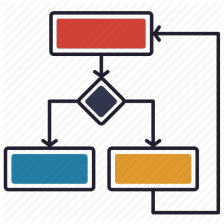
1 k-means算法
输入:
样本数据
D
=
c
o
r
1
,
c
o
r
2
,
.
.
.
,
c
o
r
n
,
c
o
r
i
=
(
x
i
,
y
i
)
D={cor_1, cor_2, ..., cor_n}, cor_i=(x_i, y_i)
D=cor1,cor2,...,corn,cori=(xi,yi),
聚类簇数:k
迭代次数:steps
计算过程:
从数据集D中随机选取k个数据作为簇中心点center={c_1, c_2,..., c_k}
令簇类:cluster_1, ..., cluster_k
while(steps--):
	for j=0,1, ..., n do
	计算每个源数据与簇中心点距离d=|cor_1-c1|
	根据最近的均值向量确定cor_i所属的簇cluster_i(i=0,1, ..., k-1)
	将对应的数据归入簇
	endfor
	for i=0, 1, ..., k-1 do
		更新簇中心均值向量:center_i = (1/cluster_i数据个数)*sum(cluster_i所有数据)
		if center_i != c_i then
			c_i = center_i
		else
			保持原中心点不变
		end if
	endfor
输出:簇划分 c l u s t e r 1 , c l u s t e r 2 , . . . , c l u s t e r k cluster_1, cluster_2, ..., cluster_k cluster1,cluster2,...,clusterk
2 python实现
2.1 Demo
import matplotlib.pyplot as plt
import numpy as np
import math
'''原始数据.'''
x = [0.697, 0.774, 0.634, 0.608, 0.556, 0.403, 0.481, 0.437, 0.666, 0.243,
     0.245, 0.343, 0.639, 0.657, 0.360, 0.593, 0.719, 0.359, 0.339, 0.282,
     0.748, 0.714, 0.483, 0.478, 0.525, 0.751, 0.532, 0.473, 0.725, 0.446]
y = [0.460, 0.376, 0.264, 0.318, 0.215, 0.237, 0.149, 0.211, 0.091, 0.267,
     0.057, 0.099, 0.161, 0.198, 0.370, 0.042, 0.103, 0.188, 0.241, 0.257,
     0.232, 0.346, 0.312, 0.437, 0.369, 0.489, 0.472, 0.376, 0.445, 0.459]
# 原始数据图像
plt.figure(figsize=(8, 8))
plt.scatter(x, y, color='r')
plt.xlim(0.1, 0.9)
plt.ylim(0, 0.9)
plt.xlabel("x data")
plt.ylabel("y data")
plt.grid(True)
plt.savefig("./images/source_data.png", format='png')
coordinate = [data for data in zip(x, y)]
print("coordinate: {}".format(coordinate))
print("data 0 x: {}".format(coordinate[0][0]))
print("data 0 y: {}".format(coordinate[0][1]))
rand = np.random.randint(0, 30)
print("random number: {}".format(rand))
init = coordinate[rand]

def direct_line():
    print("---------\n")

def k_mean_cluster(k, steps):
    '''k-means聚类
    参数:
    	k:簇个数;
    	steps:迭代次数;
    返回:
    	center_data:簇中心点
    	classification_temp:所有参数及参数值
    '''
    init_num = np.random.randint(0, 30, (1, k))
    # 随机获取初始簇中心点
    center_data = [coordinate[i] for i in init_num[0]]
    '''
    locals()函数动态建立列别,存储k个簇的数据
    通过classification_temp['cluster_0'],..., classification_temp['cluster_(k-1)']获取分类数据
    '''
    for step in range(steps):
        classification_temp = locals()
        for i in range(k):
            classification_temp['cluster_' + str(i)] = []
		'''
		原始数据聚类:j为原始数据,i为簇分类数
		将每个数据利用距离进行聚类
		'''
        for j in range(len(coordinate)):
            dis_temp = []
            for i in range(len(center_data)):
                dis = math.pow(init_data[i][0]-coordinate[j][0], 2) + math.pow(init_data[i][1]-coordinate[j][1], 2)
                dis = math.sqrt(dis)
                dis_temp.append(dis)
            dis_min = min(dis_temp)
            dis_index = dis_temp.index(dis_min)
            for i in range(k):
                '''Adding data to croresponding cluster.'''
                if i == dis_index:
                    classification_temp['cluster_'+str(dis_index)].append(j)
		'''更新聚类中心坐标'''
        for i in range(k):
            xx = []
            yy = []
            for index in classification_temp['cluster_'+str(i)]:
                xx.append(coordinate[index][0])
                yy.append(coordinate[index][1])
            xx_mean = np.mean(xx)
            yy_mean = np.mean(yy)
            if xx_mean != center_data[i][0] or yy_mean != center_data[i][0]:
                center_data[i]= (xx_mean, yy_mean)
    print("cluster center: {}".format(center_data))

    '''plot final results.'''
    plt.figure(figsize=(8, 8))
    plt.xlim(0.1, 0.9)
    plt.ylim(0, 0.9)
    plt.xlabel("x data")
    plt.ylabel("y data")
    plt.grid(True)
    for i in range(k):
        direct_line()
        markers = ['.', 's', '^', 'P']
        print("cluster {}: data: {}".format(i, classification_temp['cluster_'+str(i)]))
        xx = []
        yy = []
        for index in classification_temp['cluster_'+str(i)]:
            xx.append(coordinate[index][0])
            yy.append(coordinate[index][1])
        plt.scatter(xx, yy, marker=markers[i])
        plt.scatter(init_data[i][0], center_data[i][1], marker=markers[3], linewidths=1, color='r')
        plt.savefig("./images/k-mean_cluster.png", format="png")
    return center_data, classification_temp

if __name__ == "__main__":
    center, cluster = k_mean_cluster(3, 50)
    for i in range(3):
    	print("cluster {} data: {}".format(i, cluster['cluster_'+str(i)]))
    print("center: {}".format(center))
2.2 Result
2.2.1 结果
cluster 0 data: [0, 3, 22, 23, 24, 25, 26, 27, 28, 29]
cluster 1 data: [5, 6, 7, 9, 10, 11, 14, 17, 18, 19]
cluster 2 data: [1, 2, 4, 8, 12, 13, 15, 16, 20, 21]
center: [(0.5717999999999999, 0.41369999999999996), (0.3492, 0.2076), (0.6699999999999999, 0.2028)]
2.2.2 可视化


其中,红色加号为聚类中心,三种形状:圆形,三角形,正方形分别为簇。
3 小结
k-means聚类,先随机在原始数据中挑选k个簇中心点,依次计算每个原始数据到中心点的距离,将到中心点距离最近的数据归为一类,遍历所有源数据后,对更新k个簇中心点,该簇中心点使用上次聚类数据的均值作为新的中心点,继续迭代,直到聚类中心不再改变或达到迭代次数终止。


 5150
5150


 被折叠的 条评论
为什么被折叠?
被折叠的 条评论
为什么被折叠?
 到【灌水乐园】发言


