


目录

1 完整代码
// 定义研究区(这里以用户自定义几何区域为例,可以替换为具体坐标或导入的 shapefile)
var geometry = table; // 示例区域
// 指定年份(可在2010-2020之间选择,例如 2015)
var year = 2010;
// 定义时间范围
var startDate = ee.Date.fromYMD(year, 1, 1);
var endDate = ee.Date.fromYMD(year, 12, 31);
// 加载 MODIS MOD11A2 地表温度数据集(单位:Kelvin,8天合成)
var modisLST = ee.ImageCollection('MODIS/006/MOD11A2')
.filterDate(startDate, endDate)
.filterBounds(geometry)
.select('LST_Day_1km'); // 选择白天 LST 数据
// 将 Kelvin 转换为摄氏度并处理比例因子 (scale factor: 0.02)
var lstCelsius = modisLST.map(function(image) {
return image.multiply(0.02).subtract(273.15)
.rename('LST_Celsius')
.set('system:time_start', image.get('system:time_start'));
});
// 按月聚合数据(计算每月平均 LST)
var months = ee.List.sequence(1, 12);
var monthlyLST = ee.ImageCollection.fromImages(
months.map(function(month) {
var start = ee.Date.fromYMD(year, month, 1);
var end = start.advance(1, 'month');
var monthlyMean = lstCelsius
.filterDate(start, end)
.mean()
.clip(geometry);
return monthlyMean
.set('month', month)
.set('system:time_start', start.millis());
})
);
// 可视化参数(可选,用于检查结果)
var visParams = {
min: -10,
max: 40,
palette: ['blue', 'green', 'yellow', 'red']
};
// 在地图上显示某个月的数据(例如7月)
Map.centerObject(geometry, 8); // 调整缩放级别
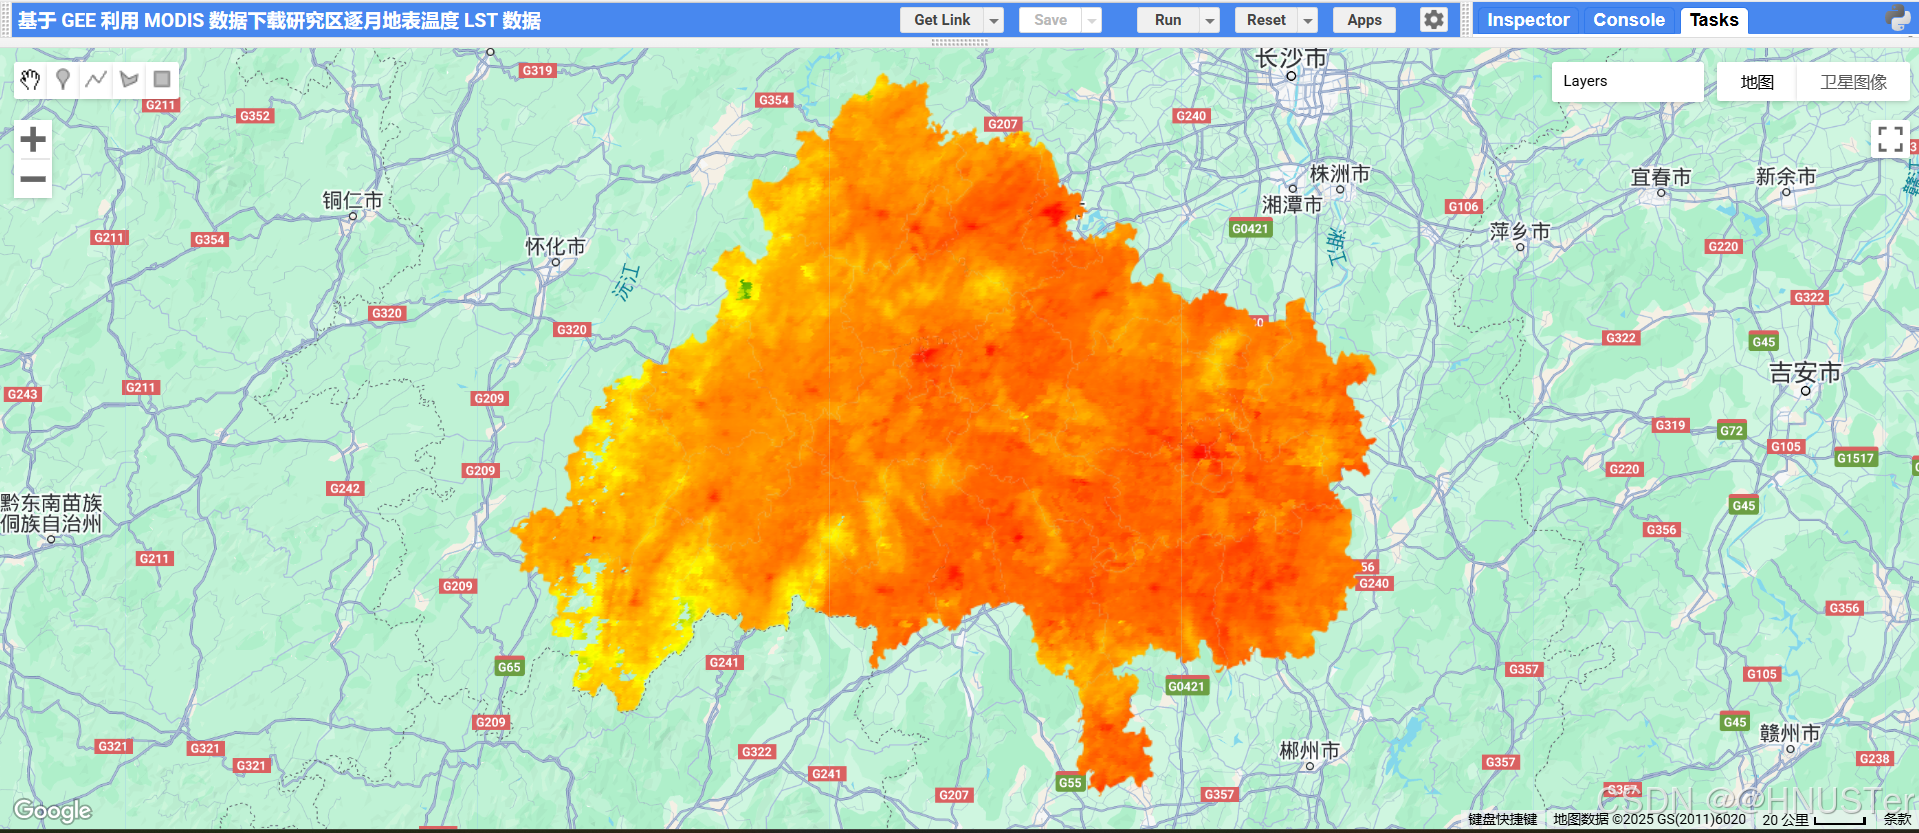
Map.addLayer(monthlyLST.filter(ee.Filter.eq('month', 7)).first(), visParams, 'July LST');
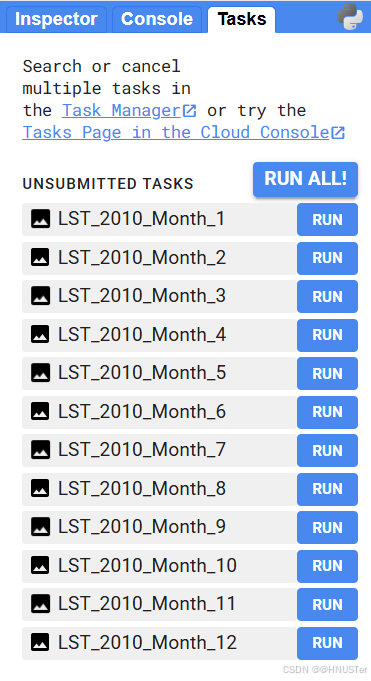
// 导出逐月数据到 Google Drive
monthlyLST.evaluate(function(result) {
var features = result.features;
for (var i = 0; i < features.length; i++) {
var month = features[i].properties.month;
Export.image.toDrive({
image: monthlyLST.filter(ee.Filter.eq('month', month)).first(),
description: 'LST_' + year + '_Month_' + month,
folder: 'GEE_LST_Data',
scale: 1000, // 分辨率(米),MODIS LST 为 1km
region: geometry,
maxPixels: 1e13
});
}
});
// 打印数据集信息(可选,用于调试)
print('Monthly LST Collection:', monthlyLST);2 运行结果


 1894
1894

 被折叠的 条评论
为什么被折叠?
被折叠的 条评论
为什么被折叠?
 到【灌水乐园】发言


