


一、LST数据集
20个LST数据产品
中国陆域及周边逐日1km全天候地表温度数据集(TRIMS LST;2000-2022)
论文A global seamless 1 km resolution daily land surface temperature dataset (2003–2020)
GLASS地表温度产品(Land Surface Temperature,简称LST)
GLASS产品集目前有二套瞬时LST产品。第一套是利用一种多算法集成方法,针对单一反演算法在大观测角度和高水汽含量情况下反演精度低的问题,将9种常见的分裂窗算法采用集成方法构建LST多算法集成反演模型。另一套AVHRR LST产品是基于一个改进型通用劈窗算法(Liu等,2019)。该算法是在通用劈窗算法的基础上增加了两个热红外通道亮温差的二次项,进而提高了原算法在高水汽含量下的反演精度。
马里兰大学GLASS产品
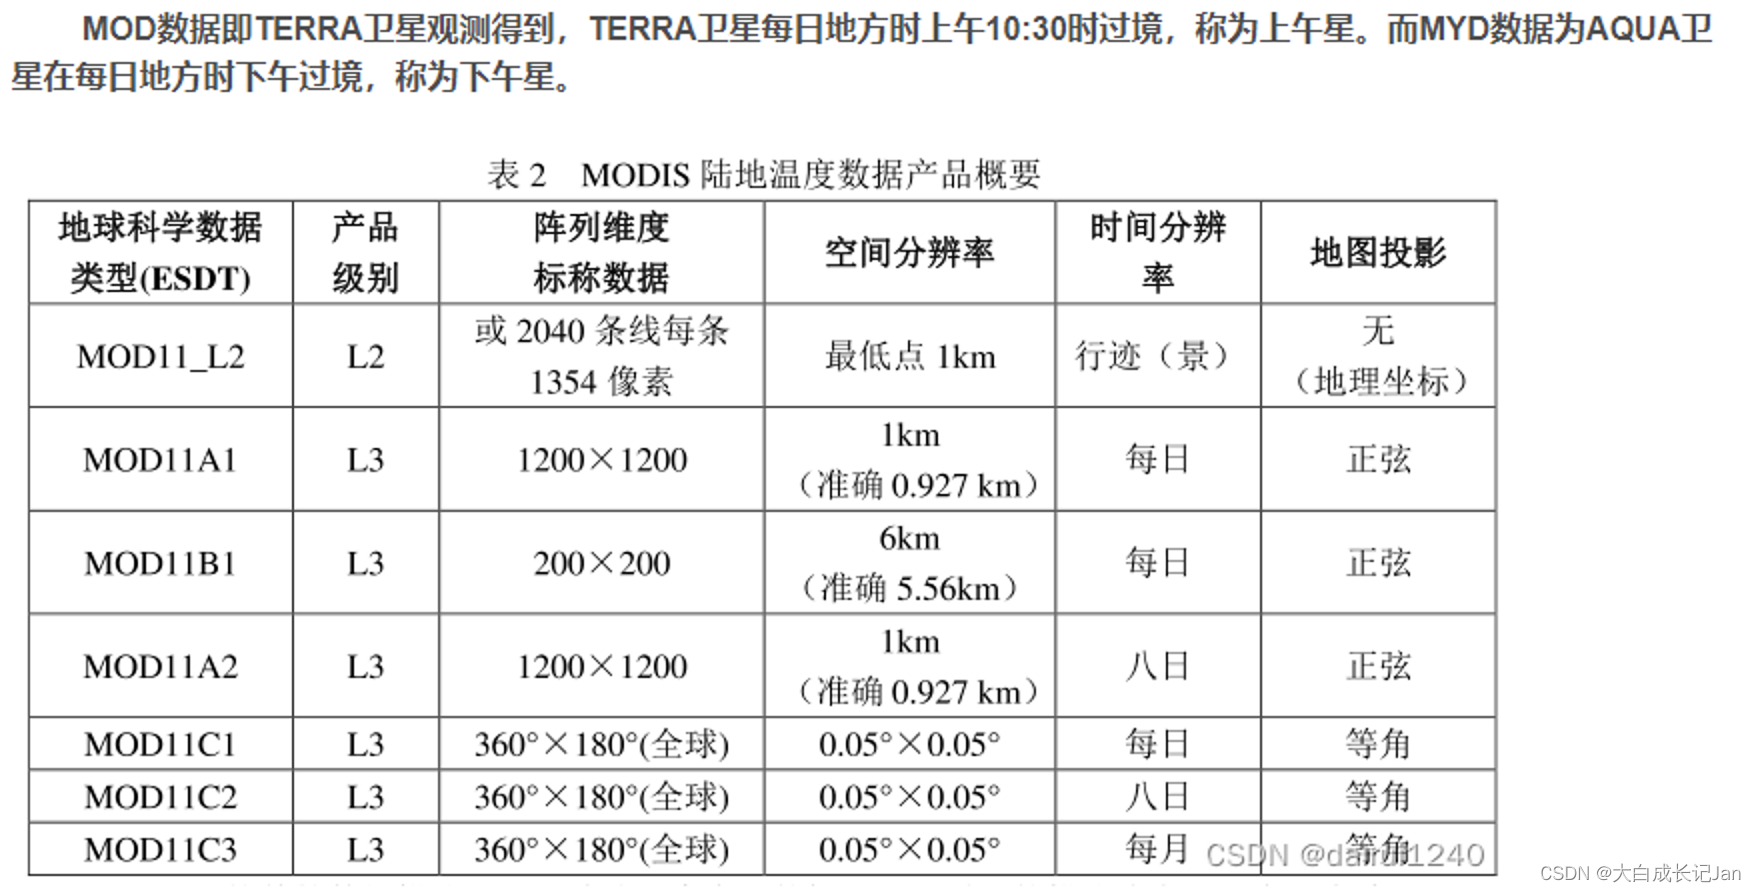
MODIS——NASA
TERRA为上午星,从北向南于地方时10:30左右通过赤道,AQUA为下午星,从南向北于地方时13:30左右通过赤道。主要下载的是MOD A11全球1km数据( MOD11 A1为地表温度和发射率日产品,产品己经进行了几何校正与辐射校正,投影坐标为球面曲线正弦投影,空间分辨率为1000m。
GEE——Modis_LST地表温度产品时间序列分析
Landsat
Landsat Land Surface Temperature线上交互
Landsat轨道查询
GEE反演landsat计算出
二、 GEE下载10mLST
GEE在2021年的时候就已经将Landsat8数据整合到C02数据集中, Landsat8数据的L2级产品的热红外波段ST_B10就直接对应着地表温度,只需简单计算即可获取摄氏度
var geometry = ee.FeatureCollection("projects/ee-wn1206/assets/beijing_urban").geometry();
 // A function that scales and masks Landsat 8 (C2) surface reflectance images.
  function prepSrL8(image) {

  // Bit 0 - Fill
  // Bit 1 - Dilated Cloud
  // Bit 2 - Cirrus
  // Bit 3 - Cloud
  // Bit 4 - Cloud Shadow
    // Develop masks for unwanted pixels (fill, cloud, cloud shadow).
    var qaMask = image.select('QA_PIXEL').bitwiseAnd(parseInt('11111', 2)).eq(0);
    //this is what is used ,this is cloud mask
    var saturationMask = image.select('QA_RADSAT').eq
最低0.47元/天 解锁文章


 1155
1155

 被折叠的 条评论
为什么被折叠?
被折叠的 条评论
为什么被折叠?
 到【灌水乐园】发言


