


首先定义出几个数组,用于绘制图形
绘制单幅图(不加修饰)
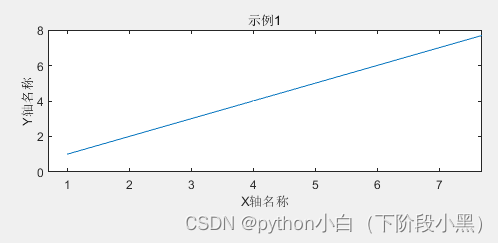
subplot(2,1,1);plot(x1);title('示例1');xlabel('X轴名称');ylabel('Y轴名称');
其中,subplot(2,1,1)表示创建一个2行1列的绘图区域,顺序是从左到右、从上到下排列的,然后后面的1表示后续的绘图在第一个子图中进行;plot(x1)表示绘制的X轴为X1数组,Y轴默认和X1数组相同;title是图的标题;xlabel是X轴名称;ylabel是Y轴名称,后续重复处不再作解释
绘制单幅图(加修饰)
x1=[1,2,3,4,5,6,7,8];
x2=[15,13,11,9,7,5,3,1];
y1=[2,4,6,8,10,12,14,16];
y2=[21,18,15,13,11,9,7,5];
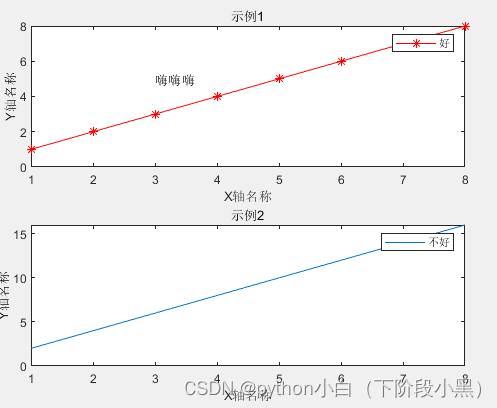
subplot(2,1,1);plot(x1,'r*-');title('示例1');xlabel('X轴名称');ylabel('Y轴名称');text(3,5,'嗨嗨嗨');

其中'r*-'表示曲线样式,这里指的是图形为红色,数据用星点表示,数据点之间用实线连接,当然还可以尝试不同的风格,具体可参照如下帮助文档中内容:
           b     blue          .     point              -     solid
%          g     green         o     circle             :     dotted
%          r     red           x     x-mark             -.    dashdot
%          c     cyan          +     plus               --    dashed
%          m     magenta       *     star             (none)  no line
%          y     yellow        s     square
%          k     black         d     diamond
%          w     white         v     triangle (down)
%                              ^     triangle (up)
%                              <     triangle (left)
%                              >     triangle (right)
%                              p     pentagram
%                              h     hexagram
text(3,5,'嗨嗨嗨')表示在x=3,y=5的位置,输入指定文本,这里是嗨嗨嗨,位置如图所示
绘制两幅子图在一个画板
subplot(2,1,1);plot(x1,'r*-');title('示例1');xlabel('X轴名称');ylabel('Y轴名称');text(3,5,'嗨嗨嗨'); legend('好');
subplot(2,1,2);plot(x1,y1);title('示例2');xlabel('X轴名称');ylabel('Y轴名称');legend('不好');
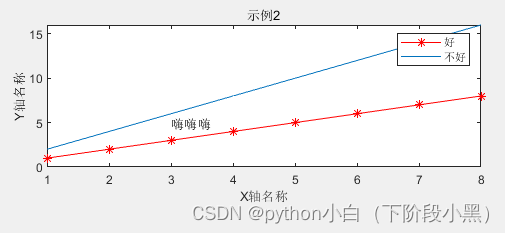
将曲线绘制到同一个坐标系中
只需要在两个plot之间插入hold on语句即可
subplot(2,1,1);plot(x1,'r*-');title('示例1');xlabel('X轴名称');ylabel('Y轴名称');text(3,5,'嗨嗨嗨');
hold on ;plot(x1,y1);title('示例2');xlabel('X轴名称');ylabel('Y轴名称');legend('好','不好');


 4354
4354


 被折叠的 条评论
为什么被折叠?
被折叠的 条评论
为什么被折叠?
 到【灌水乐园】发言


