


 文章介绍了如何使用Python的Matplotlib库及其子库pyplot来绘制线状图,包括导入库、创建数据、设置线条样式以及添加标题和轴标签的步骤,并提供了一个完整的代码示例。
使用Matplotlib库绘制线状图
前言
Matplotlib 是一个用于创建可视化图表的 Python 库。下面是使用 Matplotlib 绘制线状图的基本步骤:

1.导入 Matplotlib 库及其子库 pyplot。
import matplotlib.pyplot as plt
2.创建数据。
通常,绘制线状图需要一组 x 坐标和 y 坐标的数据。可以通过 Python 的列表或 NumPy 数组来表示这些数据。
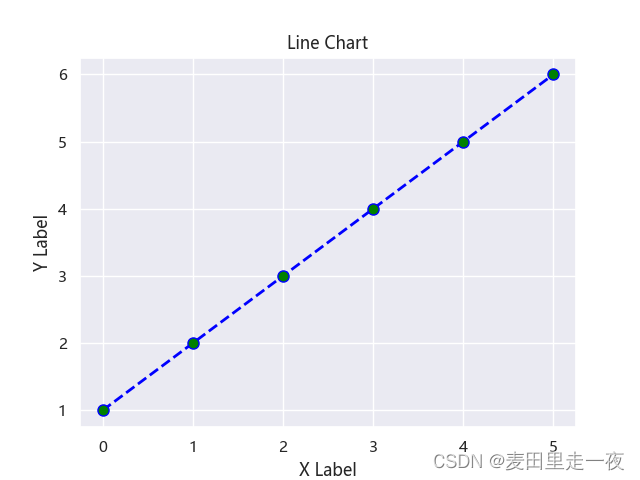
x = [0, 1, 2, 3, 4, 5]
y = [1, 2, 3, 4, 5, 6]
3.绘制线状图。
可以使用 plt.plot() 方法来绘制线图。在 plot() 方法中传递 x 和 y 数据,并指定线条的颜色、线型、宽度等参数。
plt.plot(x, y, color='blue', linestyle='dashed', linewidth = 2, marker='o', markerfacecolor='green', markersize=8)
4.添加标题和标签。
可以使用 plt.title()、plt.xlabel() 和 plt.ylabel() 方法来添加图表的标题、x 轴和 y 轴的标签。
plt.title('Line Chart')
plt.xlabel('X Label')
plt.ylabel('Y Label')
5.显示图表。
最后,使用 plt.show() 方法来显示图表。
plt.show()
完整代码示例:
import matplotlib.pyplot as plt

# 创建数据
x = [0, 1, 2, 3, 4, 5]
y = [1, 2, 3, 4, 5, 6]

# 绘制线状图
plt.plot(x, y, color='blue', linestyle='dashed', linewidth = 2, marker='o', markerfacecolor='green', markersize=8)

# 添加标题和标签
plt.title('Line Chart')
plt.xlabel('X Label')
plt.ylabel('Y Label')

# 显示图表
plt.show()
执行结果
请通过以下地址来体验ChatGPT
https://www.zhiyidata.cn/chatgpt/play


 7745
7745


 被折叠的 条评论
为什么被折叠?
被折叠的 条评论
为什么被折叠?
 到【灌水乐园】发言


