


QCustomPlot 是一个基于Qt的画图和数据可视化C++控件。QCustomPlot 致力于提供美观的界面,高质量的2D画图、图画和图表,同时为实时数据可视化应用提供良好的解决方案。 该绘图库专注于制作美观、出版物质量高的2D绘图、图形和图表,并为实时可视化应用程序提供高性能。
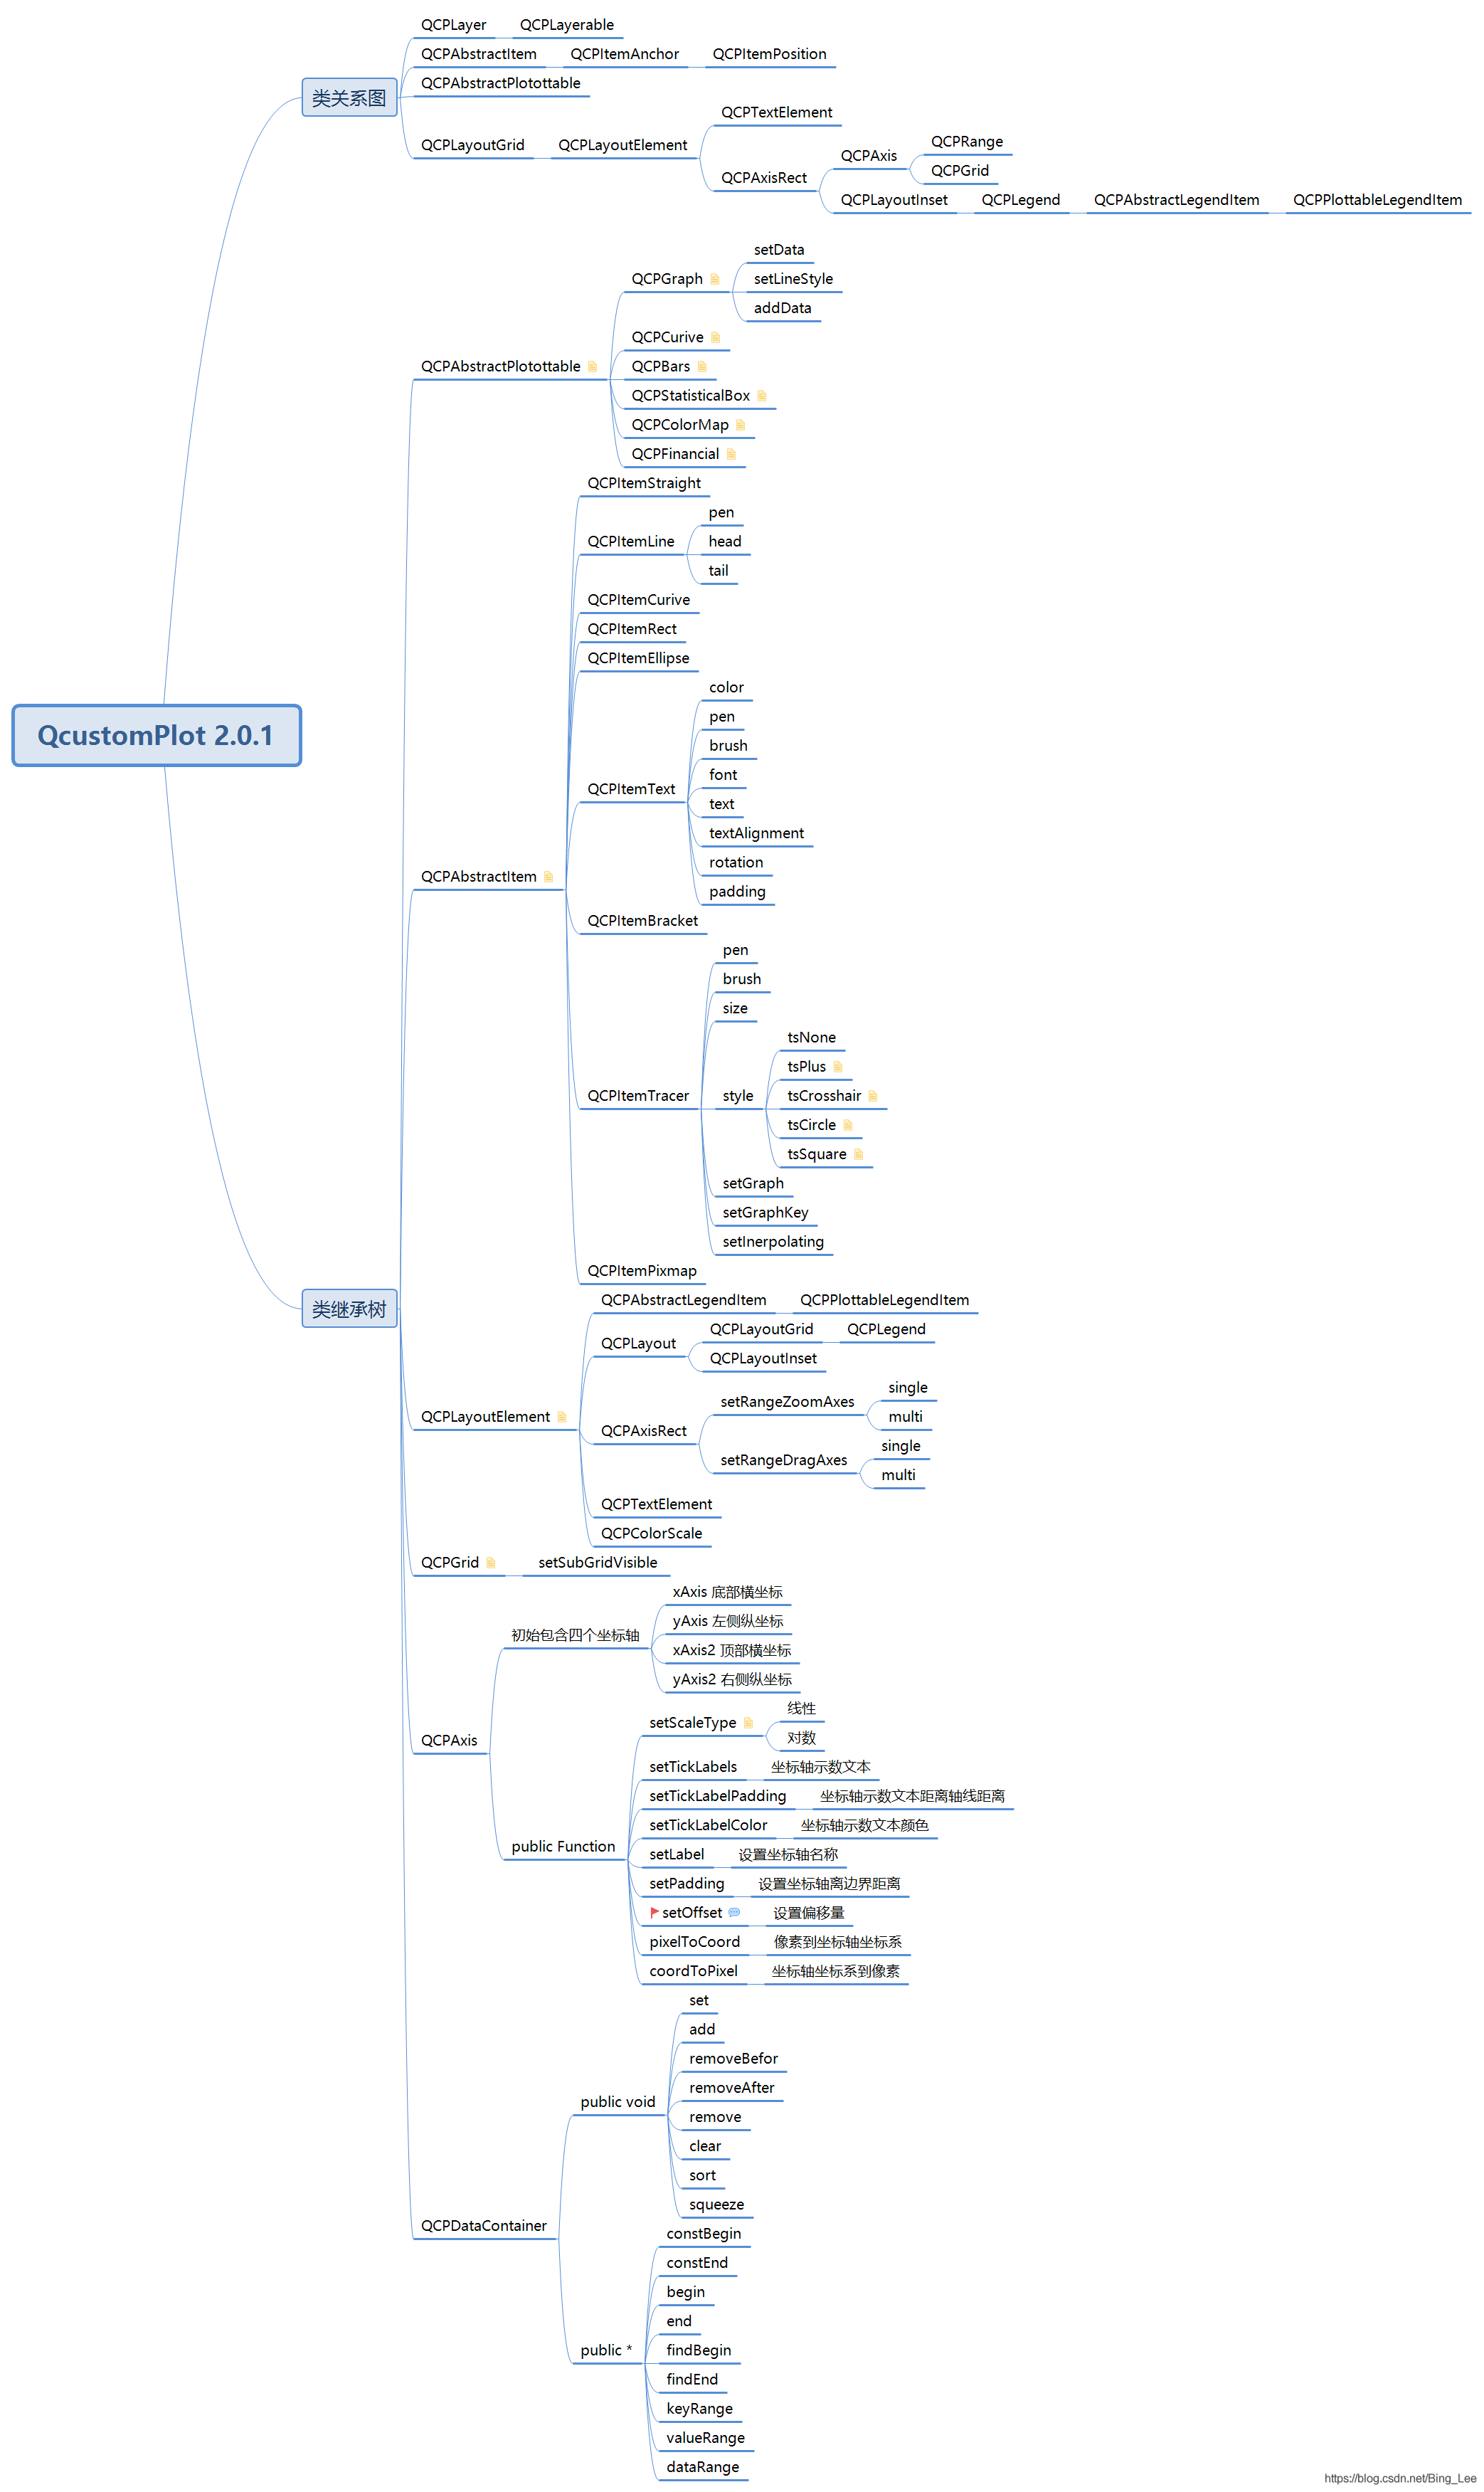
QCustomPlot的几个重要类
QCustomPlot 图表类:用于图表的显示和交互;
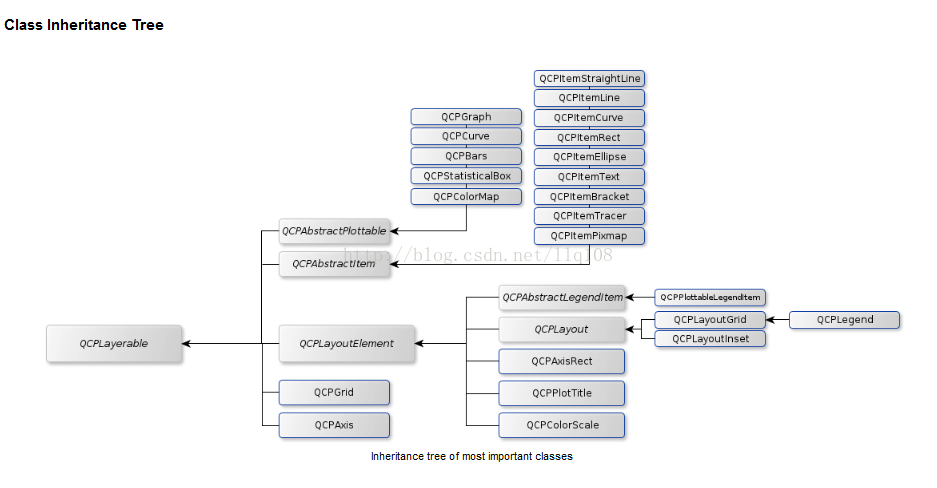
QCPLayer 图层:管理图层元素(QCPLayerable)
QCPLayerable图层元素:所有可显示的对象都是继承自图层元素;
QCPAbstractPlottable 绘图元素:包含 折线图(QCPGraph)、曲线图(QCPCurve)、柱状图(QCPBars)、QCPStatiBox(盒子图)、QCPColorMap(色谱图)、QCPFinancial(金融图);
QCPAxisRect 坐标轴矩形:一个坐标轴矩形默认包含上下左右四个坐标轴,但是可以添加多个坐标轴;
QCustomPlot下载
下载地址:https://www.qcustomplot.com/index.php/download
选择版本2.1.0 QCustomPlot.tar.gz
QCustomPlot 的使用
解压下载的文件
把qcustomplot.h和qcustomplot.cpp放到自己的项目工程(复制文件并qt 的目录树添加存在的头文件源文件)。在使用QCustomPlot类的地址包含头文件 #include "qcustomplot.h"
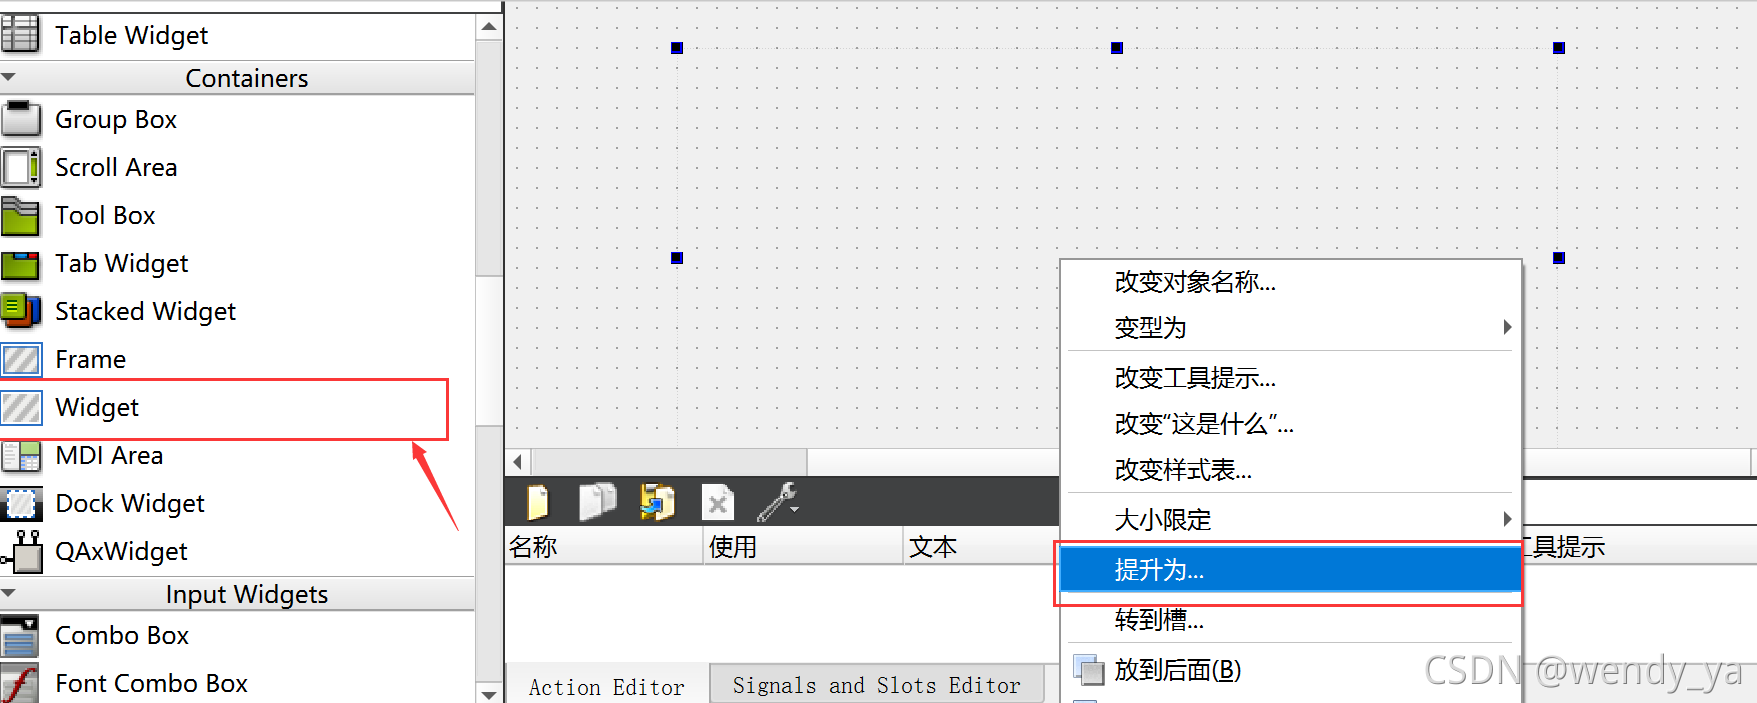
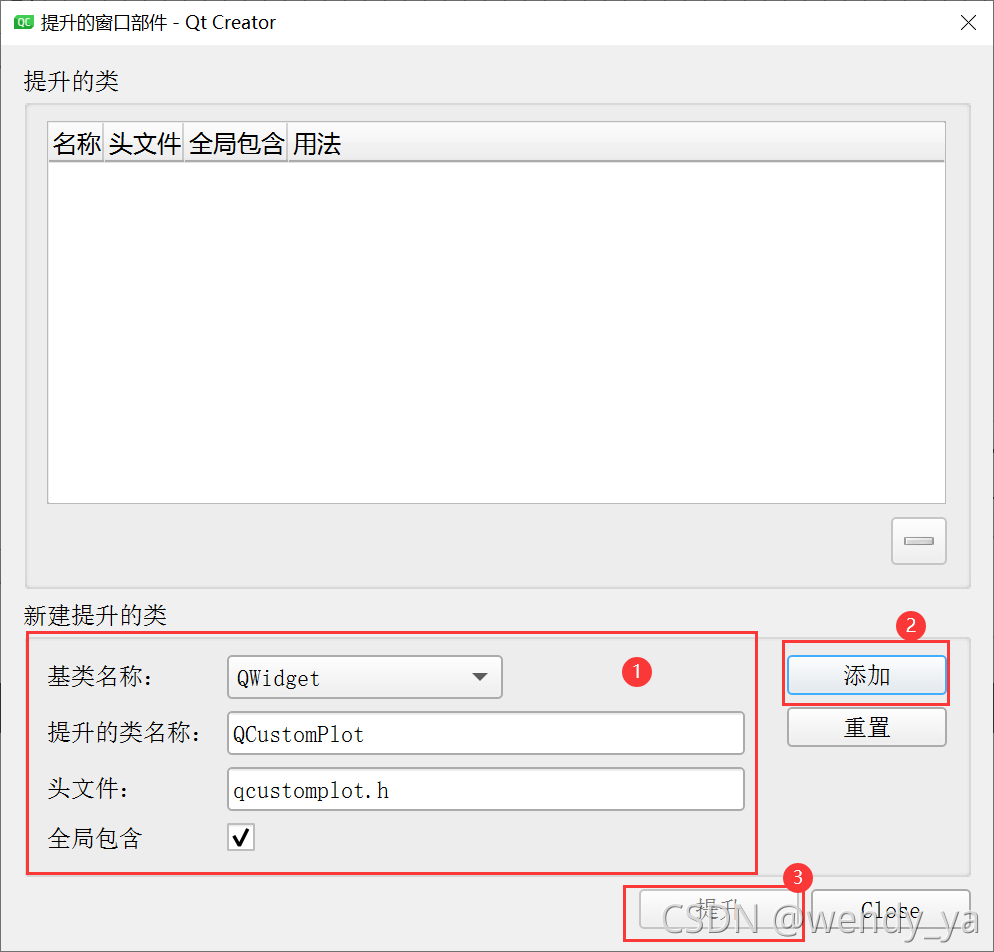
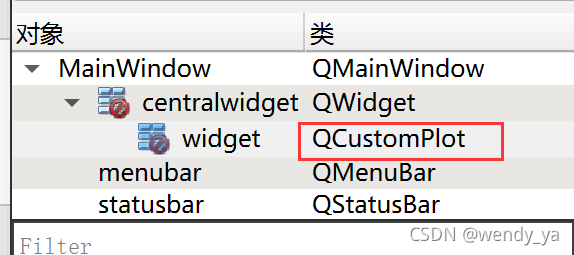
拖拽控件提升类
在UI Designer中,可以拖动一个Widget控件到ui设计器上,对这个窗体点击右键,选择提升QCustomPlot
如果是代码方式添加就不需要对控件提升的这布操作,直接使用QCustomPlot 类声明对象即可。如
    MainWindow::MainWindow(QWidget *parent) :
    QMainWindow(parent),
    ui(new Ui::MainWindow)
{
    ui->setupUi(this);
    QCustomPlot *mPlot = new QCustomPlot(this);
    setCentralWidget(mPlot);
}
添加printsupport
如果Qt版本在5.0以上,需要在.pro文件中的QT变量加上printsupport:
QT += widgets printsupport
添加帮助文档
在下载的documentation文件夹下有个qcustomplot.qch文件,将它拷贝Qt的安装文档目录下(一般为qt5.9\Docs\Qt-5.9,会根据你的Qt版本号而做相应变动),然后在QtCreator ——>工具——>选项——>帮助——>文档——>添加,选择qcustomplot.qch文件,确定,以后按F1就能跳转到QCustomPlot的帮助
绘制具体图形
    QVector<double> x(101), y(101); //初始化向量x和y
    for (int i=0; i<101; ++i)
    {
      x[i] = i/50.0 - 1; // x范围[-1,1]
      y[i] = x[i]*x[i]; // y=x*x
    }
    mPlot->addGraph();//添加数据曲线(一个图像可以有多个数据曲线)
    mPlot->setViewport(QRect(0,0,400,400));

    // graph(0);可以获取某个数据曲线(按添加先后排序)
    // setData();为数据曲线关联数据
    mPlot->graph(0)->setData(x, y);
    mPlot->graph(0)->setName("第一个示例");// 设置图例名称
    // 为坐标轴添加标签
    mPlot->xAxis->setLabel("x");
    mPlot->yAxis->setLabel("y");
    // 设置坐标轴的范围,以看到所有数据
    mPlot->xAxis->setRange(-1, 1);
    mPlot->yAxis->setRange(0, 1);
    mPlot->legend->setVisible(true); // 显示图例
    // 重画图像
    mPlot->replot();
实战心得
显示折线图(QCPGraph),调用QCustomPlot类的addGraph函数,表示添加一条曲线。
removeGraph //表示删除一条曲线
从QCustomPlot调用graph函数,则得到一条具体的曲线(QCPGraph类指针)。
曲线设置数据源,则调用QCPGraph的setData函数。
customPlot->graph(0)->data().data()->clear();//清空数据
刷新整个图表 customPlot->replot();//刷新
通过QCustomPlot的成员变量指针 xAxis,yAxis,则获取数值坐标轴(QCPAxis)。
类介绍
QCustomPlot
addGraph 添加曲线
如果keyAxis和valueAxi为空,则底部(xAxis)用作键,左边(yAxis)用作值轴;如果指定,keyAxis和valueAxis必须位于
removeGraph 删除图元
bool QCustomPlot::removePlottable(QCPAbstractPlottable * plottable)//相关的图例项目也会被移除
graph 获取图元
QCPAbstractItem * QCustomPlot::item() const //获取项
addLayer //创建一个图层
setCurrentLayer
removeLayer //删除一个图层不会删除图层对应的的对象
layer、currentLayer 获取图层
void QCustomPlot::setViewport(const QRect & rect) //视图窗口
axisRects //获取坐标轴的矩形区域,可以再调用setBackground设置区域的背景色
QCPAxis *xAxis, *yAxis, *xAxis2, *yAxis2; //坐标
QCPLegend *legend; //图例
void QCustomPlot::replot() 重绘,设置刷新优先级为QCustomPlot::reQueuedReplot,这种方式下,实际的重绘将会延迟到下一个事件循环中,这样的话,多个连续的调用的重绘将仅仅造成一次重绘,避免了冗余重绘并且提高了性能
QCPSelectionRect *selectionRect() //获取选择框区域对象
selectionChangedByUser 改变了做选择的区域的时候发射。 但当通过直接调用对象上的setSelected()/setSelection()或deselectAll来以编程方式更改对象的选择状态时,它不会发出。
    mPlot = new QCustomPlot(this);
    mPlot->setGeometry(QRect(0,0,800,800));
    mPlot->setInteractions(QCP::iRangeDrag|QCP::iRangeZoom|QCP::iSelectPlottables);
    mPlot->setSelectionRectMode(QCP::SelectionRectMode::srmSelect);
    connect(mPlot,SIGNAL(selectionChangedByUser()),this,SLOT(selectionChangedByUserslot()));

void QCustomPlotWidget::selectionChangedByUserslot()
{
    qDebug() << "selectionChangedByUserslot";

    for(int i=0;i<mPlot->graphCount();i++)
    {
        if(mPlot->graph(i)->selected())
        {
            QCPDataSelection selection =mPlot->graph(i)->selection();
            //遍历选中范围
            for(int j=0;j<selection.dataRangeCount();j++)
            {
                QCPDataRange dataRange = selection.dataRange(j);
                //遍历数据
                for(int k=dataRange.begin();k<dataRange.end();k++)
                {
                   double key = mPlot->graph(i)->data()->at(k)->key;
                   double value = mPlot->graph(i)->data()->at(k)->value;
                   int a = 1;
                   qDebug() << "key:" << key <<"value:"<< value;

                }
            }
        }
    }
}setSelectionRectMode(QCP::SelectionRectMode mode); //设置选择框选的模式
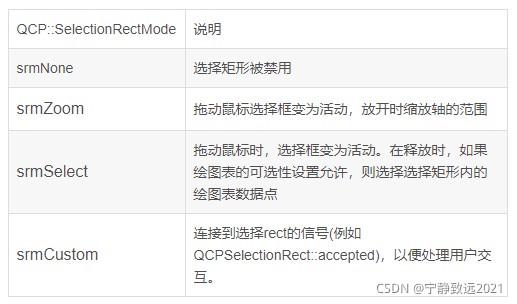
setSelectionRectMode设置为srmSelect选取数据模式,接着还需要对QCPAbstractPlottable对象调用setSelectable (QCP::SelectionType selectable)设定数据选取的方式。
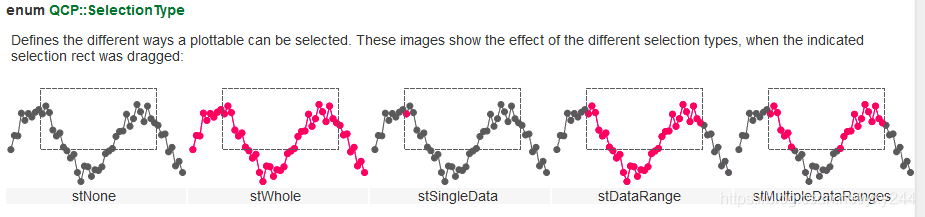
QCP::SelectionType说明
stNone图表不可选
stWhole 选择的行为类似于stMultipleDataRanges,但是如果选择了任何数据点,则整个绘图表将被选中
stSingleData一次可以选择一个单独的数据点
stDataRange可以选择多个连续数据点(一个数据范围)。
stMultipleDataRanges可以选择任何数据点/范围的组合。
setInteraction
如 iRangeDrag(可拖放的) iRangeZoom 可缩放的) iSelectPlottables(选中曲线高亮显示)CustomPlot 可能的交互为 QCP::Interaction 枚举的组合
坐标轴范围的交互:Axis range manipulation 是由 QCP::iRangeDrag 和 QCP::iRangeZoom 所控制的,当各自的交互使能的时候,用户可以通过拖拽坐标轴和滑动滚轮的方式来缩放图像,详细的看如何控制坐标轴的方式请看 QCPAxisRect::setRangeDrag和 QCPAxisRect::setRangeZoom,QCPAxisRect::setRangeDragAxes, QCPAxisRect::setRangeZoomAxes。
绘图板的数据选择:Plottable data selection 是由 QCP::iSelectPlottables 所控制的,如果 QCP::isSelectPlottables 被设置了,用户可以选择绘图板(图像,曲线,柱状图)以及他们的数据,通过在他们附件点击他们(需要设置 setSelectionTolerance),无论用户是否真的选择了绘图表,其数据可以被 QCPAbstractPlottable::setSelecttable 方法所限制。详细的请看有关数据选择机制的页面,为了获取所有当前选中的绘图板的列表,调用函数 selectedPlottables,如果你仅仅对 QCPGraphs 感兴趣,你可能使用便利函数 selectedGraphs
项目选择:Item selection是由 QCP::iSelectItems 所控制的,如果设置了 QCP::iSelectItems,用户可以选择项目(QCPItemLine,QCPItemText 等)通过点击他们或者在他们的附近点击他们,为了找出是否指定的项目被选中了,可以调用函数 QCPAbstractItem::selected(),为了检索所有当前选中项目的列表,调用 selectedItems。
坐标轴选择:Axis selection 是由 QCP::iSelectAxes 所控制的,如果设置了 QCP::iSelectAxes 用户可以通过点击坐标轴来选中他们,哪些部分被选中(比如 Axis base line, tick labels, axis label)可以通过每一个坐标轴的QCPAxis::setSelectableParts 选项来判断。为了检索当前所包含的选中部分的列表,调用 selectedAxes,坐标轴的哪一个部分被选中可以通过 **QCPAxis::selectedParts()**来判断
图例选择:Legend selection是由 QCP::iSelectAxes来控制的,如果设置了这个,用户可以选择图例或图例中单独的项目通过点击他们,哪个部分实际是可以选择的可以通过QCPLegend::setSelectableParts来控制,为了找出图例或者其内部的任何项目是选中的,检查QCPLegend::selectedParts的值,为了找出哪些子项目被选中了,调用QCPLegend::selectedItems
所有其他项目的选择:All other selectable element,所有其他项目的选择(比如 QCPTextElement,或者自己派生的图层的子类)是由QCP::iSelectOther控制的,如果设置了,用户可以通过点击他们来选择他们,为了找出哪些现在被选择了,你需要去显式的检查他们选中的状态。
框选放大和拖动无法同时使用
setSelectionRectMode如果设置为srmZoom放大模式, 即使Interaction设置了拖动iRangeDrag,鼠标按下后依然是框选放大,而不会是拖动曲线。
Plottables 是用来显示 QCustomPlot 中任意的数据的类,他们都从类 QCPAbstractPlottable 中所派生出来,QCPGraph 是一个 plottable.对于其他的 plottables,普通的 plottable 的接口是如下使用的,首先,创造各自 plottables 的实例,然后添加到 QCustomPlot 中.如
mPlot2 = new QCustomPlot(this);
QCPCurve *pCurve = new QCPCurve(mPlot2->xAxis,mPlot2->yAxis);
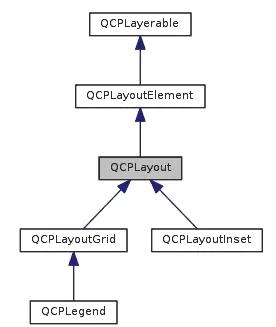
在QCustomPlot中,布局方式只有两种:
QCPLayoutGrid 网格布局
QCPLayoutInset 内嵌式布局
在QCustomPlot里面维护着一个网格布局,默认只有一个QCPAxisRect元素,而QCPAxisRect里则维护这一个内嵌式的布局,用于放置图例QCPLegend
QCPLayer 图层
Layer是可能包含对象的、控制渲染顺序的对象。对于QCustomPlot对象内部具有一个渲染顺序列表,在绘制时将会连续画出QCPLayerable对象。
QCPLayer包含有序的QCPLayerable对象。
构造函数QCPLayer(QCustomPlot* parentPlot, const QString &layerName);
父对象为QCustomPlot对象
QCPLayer和QCustomPlot的关系:调用QCustomPlot的currentLayer或者layer获取图层
默认图层
背景层、网格层、主层、坐标轴层、图例层和矩形选择区域层。
默认情况下,QCustomPlot有六个图层,分别是:“background” “grid” “main” “axes” “legend”和“overlay”(注意顺序)。最先绘制的是“overlay”层,它只包含QCustomPlot选中的矩形(QCustomPlot::selectionRect)。往后分别是“axes”和“legend”,表示默认轴和图例。在中间,有一个“main”层,它默认不含任何东西且为默认图层(QCustomPlot::setCurrentLayer)。这也就意味着所有可绘制的对象将会默认在此层。接着是QCPGrid对象(与QCPAxis紧密相连)background在最后面。当然你可以设置每个对象所在的图层(QCPLayerable::setLayer)。
控制图层渲染顺序
在绘制时控制图层非常简单:使用QCustomPlot::addLayer方法创建一个指定层的图层,如在“main”上层,然后用QCustomPlot::setCurrentLayer设置设置为你刚刚创建的图层,接下来的事情,只需要和往常一样创建图层上的对象即可,因为你设置了当前图层,所以对象都将会放置在该图层。在同一图层内点的对象是覆盖形式的,删除一个图层不会删除对应的的对象QCustomPlot::removeLayer
常用的函数:
1.QList<QCPLayerable*> children() //获取当前图层的所有图元
QCPLayerable
QCPLayerable是所有可见对象的基类,如:axes、grids、graph和item等。
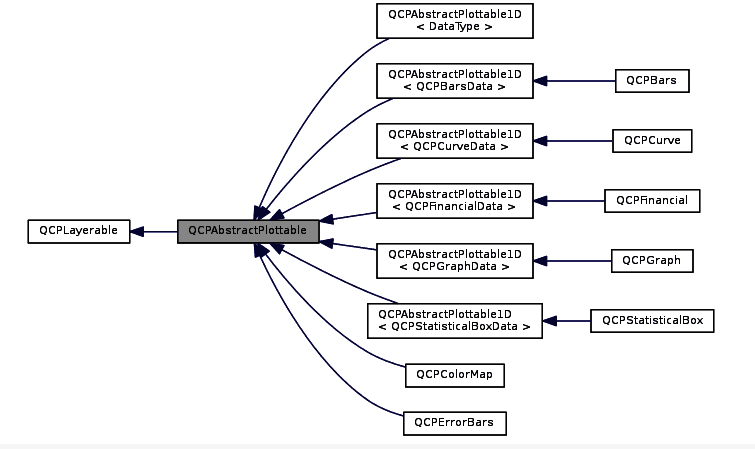
QCPAbstractPlottable
QCPAbstractPlottable 绘图元素:包含 折线图(QCPGraph)、曲线图(QCPCurve)、柱状图(QCPBars)、QCPStatiBox(盒子图)、QCPColorMap(色谱图)、QCPFinancial(金融图)
常用函数:
keyAxis、valueAxis 获取坐标轴
setKeyAxis 、setValueAxis设置坐标轴
pixelsToCoords //鼠标位置转换成数据
coordsToPixels //数据转换成鼠标位置
addToLegend 添加图例
removeFromLegend 移除图例
QCPGraph 折线
构造函数explicit QCPGraph(QCPAxis *keyAxis, QCPAxis *valueAxis);
如果keyAxis和valueAxi为空,则底部(xAxis)用作键,左边(yAxis)用作值轴
常用函数
设置曲线的字体颜色、画刷 setPen、setBrush
设置曲线的风格 setLineStyle
设置每个点的风格 setScatterStyle
设置数据 setData
setAdaptiveSampling 默认情况下,启用自适应采样。也就是在大数据的时候,QCustomplot已经自动采用自适应采样的办法帮忙采样,得到一小部分数据显示在界面上。而不是所有的数据都显示。这样界面不卡顿,cpu也不高。
缩放坐标轴,以包含所有显示的数据 rescaleAxes
是否显示曲线 setVisible
removeFromLegend 移除图例对应的曲线标记 //默认是添加一条曲线,在图例就显示一份曲线标记。
QCPDataSelection selection() //获取选中的数据区域
获取某一曲线某一点的key和value graph(i)->data()->at(k)->key和graph(i)->data()->at(k)->value
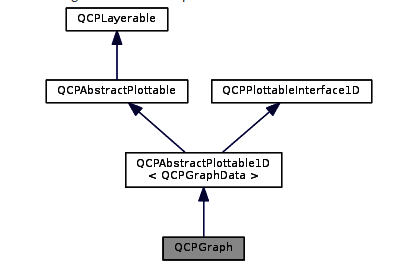
折线的类继承关系
QCPGraph和QCustomPlot的关系:QCustomPlot调用addGraph得到QCPGraph指针。
其他的具体图元类
    mPlot2 = new QCustomPlot(this);
    mPlot2->setGeometry(QRect(810,0,800,800));
    QCPCurve *pCurve = new QCPCurve(mPlot2->xAxis,mPlot2->yAxis);

    QVector<double> key(datanum),value(datanum);
    for(int i = 0 ; i < datanum; ++i)
    {

        key[i] = i;
        value[i] = qSin((i)/(2*pi));
    }
    pCurve->setData(key,value);


    mPlot2->xAxis->setRange(0,datanum);
    mPlot2->yAxis->setRange(-4, 4);

    mPlot2->xAxis->setLabel("time");
    mPlot2->yAxis->setLabel("value");

    mPlot2->legend->setVisible(true); // 显示图例

    // 重画图像
    mPlot2->replot();
QCPDataSelection及QCPDataRange
数据选择机制,即曲线选中后,获取选中的数据。
前提条件是:QCustomPlot对象调用setInteractions(QCP::iSelectPlottables);
setSelectionRectMode(QCP::SelectionRectMode::srmSelect);同时还需要调用selectionChangedByUser信号进行关联处理。两个函数进行设置。
通过QCPGraph曲线对象调用selection函数得到 QCPDataSelection 。再调用QCPDataSelection的dataRange函数得到QCPDataRange.通过QCPDataRange的begin和end得到数据的索引,最后通过索引得到曲线的key和value.
connect(mPlot,SIGNAL(selectionChangedByUser()),this,SLOT(selectionChangedByUserslot()));


void QCustomPlotWidget::selectionChangedByUserslot()
{
    qDebug() << "selectionChangedByUserslot";

    for(int i=0;i<mPlot->graphCount();i++)
    {
        if(mPlot->graph(i)->selected())
        {
            QCPDataSelection selection =mPlot->graph(i)->selection();
            //遍历选中范围
            for(int j=0;j<selection.dataRangeCount();j++)
            {
                QCPDataRange dataRange = selection.dataRange(j);
                //遍历数据
                for(int k=dataRange.begin();k<dataRange.end();k++)
                {
                   double key = mPlot->graph(i)->data()->at(k)->key;
                   double value = mPlot->graph(i)->data()->at(k)->value;
                   int a = 1;
                   qDebug() << "key:" << key <<"value:"<< value;

                }
            }
        }
    }
}
QCPAxisRec 矩形区域
QCPAxisRect是多个轴围成的一个矩形区域,也就是坐标轴.
构造函数 QCPAxisRect (QCustomPlot *parentPlot, bool setupDefaultAxes=true);
第一个参数是父对象QCustomplot,第二个参数是否设置默认轴(四个轴,但是只显示左下)。构造函数告诉我们,QCPAxisRec必须依赖与一个父对象QCustomPlot。
常用函数
addAxis //添加一个轴
QCPAxis *addAxis(QCPAxis::AxisType type, QCPAxis *axis=nullptr);
第二个参数是一个QCPAxis对象指针,
轴由内部创建。axis 为空指针,表示由内部创建并维护这个轴的生命周期,请不要直接delete返回的轴指针,而是使用removeAxis删除;
轴是外部实例。axis为指向实例的指针,表示这个轴是用户自行创建的,
removeAxis 移除特定轴
axis、axes 获取坐标区域的坐标轴
setBackground 设置坐标轴区域的背景色
QCPAxisRect和QCustomPlot的关系:QCustomPlot调用axisRects得到获取坐标轴的矩形区域对象指针。
注意:
void QCustomPlot::setViewport(const QRect & rect)
设置 QCustomPlot 的视图口,通常用户无需手动改变视图口。
视图口是图像绘制的区域,所有的设备,比如边缘计算使用视图口作为图像绘制的边界。视图口正常是 QCustomPlot 的rect(),比如一个左上角为(0,0),然后尺寸是 QCustomPlot 窗体。
不要将视图口和坐标轴矩形(QCustomPlot::axisRect)所混淆,坐标轴矩形通常是由4个轴线所围成的区域,图像和绘图板绘制在这个区域内,视图口比它要大,还包括坐标轴本身,刻度值,他们的标签,或者甚至包含附加的坐标轴矩形,颜色缩放和其他的布局单元。
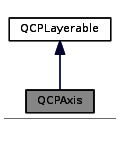
QCPAxis
QCPAxis 描述轴行为,轴需要依赖QCPAxisRect
QCPAxisRect 描述矩形区域,区域依赖于QCPCustomPlot
构造函数 QCPAxis::QCPAxis (QCPAxisRect * parent, AxisType type);
可以看出QCPAxis依赖与QCPAxisRect对象的。
QCPAxis和QCustomPlot的关系:QCustomPlot有成员变量QCPAxis *xAxis, *yAxis, *xAxis2, *yAxis2;
常用函数
QCPAxisRect *axisRect() //得到坐标轴矩形区域
QCPGrid *grid() //得到坐标轴的网格
QSharedPointer<QCPAxisTicker> ticker() //得到刻度,再调用setTickCount设置主刻度的个数
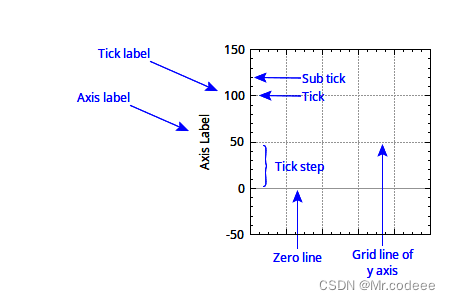
setLabel //设置名称
setVisible //坐标轴是否显示
setTickLabels //tick Label 是否显示
setLabelColor setTickLabelFont //设置坐标轴数字字体和颜色
setTicks //是否显示大刻度
setSubTicks //小刻度是否显示
setRange //设置坐标轴范围
pixelToCoord //鼠标位置(像素坐标)转换成实际的x,y轴的坐标
coordToPixel
setNumberFormat 刻度值格式 setNumberFormat("gbc");//g灵活的格式,b漂亮的指数形式,c乘号改成*
没办法直接显示鼠标停放在曲线上的点的值,需要自己重写实现。
QCPAxisTicker
自定义坐标轴,QCPAxisTicker是坐标轴的基类
调用QCPAxis的setTicker函数
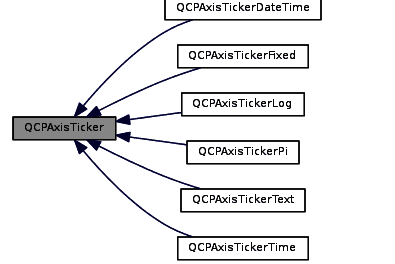
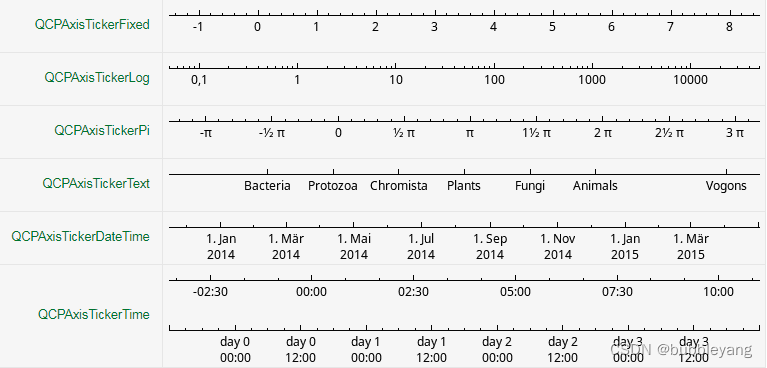
QCPAxisTickerDateTime类是日期时间坐标轴
QCPAxisTickerTime是时间轴刻度类
QCPAxisTickerPi设置Pi刻度标签
QCPAxisTickerLog设置log对数刻度标签
QCPAxisTickerFixed定义轴标尺修改指定的步长控制坐标轴刻度的数目
void setupTestQCPAxisTickerDateTime()
{
    customPlot->setInteraction(QCP::iRangeDrag, true);
    customPlot->setInteraction(QCP::iRangeZoom, true);
    QDateTime dateTime = QDateTime::currentDateTime();
    double  now = dateTime.toTime_t();//当前时间转化为秒
    //生成时间刻度对象
    QSharedPointer<QCPAxisTickerDateTime> dateTimeTicker(new QCPAxisTickerDateTime);
    customPlot->xAxis->setTicker(dateTimeTicker);
    //dateTimeTicker->setDateTimeSpec(Qt::UTC);//设施世界时间,即不加上时区的时间
    dateTimeTicker->setTickCount(12);
    dateTimeTicker->setTickStepStrategy(QCPAxisTicker::tssMeetTickCount);
    customPlot->xAxis->setSubTicks(false);
    customPlot->xAxis->setRange(now, now+3600*24);//x轴范围,从当前时间起往后推24小时
    QVector<double> yData, xData;//生成数据
    for (int i = 0; i <= 24; i++)
    {
        xData.push_back(now + i * 3600.0);
        yData.push_back(pow(double(i), 2) + 550.0*sin(double(i)/4.0));
    }
    dateTimeTicker->setDateTimeFormat("yyyy-M-d h:m");//设置x轴刻度显示格式
    customPlot->xAxis->setTickLabelRotation(30);//设置刻度标签顺时针旋转30度
    customPlot->yAxis->setRange(-1000,10000);
    customPlot->addGraph();
    customPlot->graph(0)->setData(xData, yData);//显示数据
}
3.运行结果图:
QCPGrid 网格
每一个坐标轴对应一个网格线。
构造函数explicit QCPGrid(QCPAxis *parentAxis);
第一参数是父对象坐标轴parentAxis。
常用的函数:
setVisible 网格是否显示
setSubGridVisible 子网格是否显示
setPen 设置网格的画笔
setSubGridPen设置子网格的画笔
QCPLegend 图例
该对象管理了一个QCustomPlot的一个图例。它是一个小的Box区域,包含名称和图标。通过QCPAbstarctPlottable::adddToLegend来填充QCPLegend内容,对于主图示(QCustomPlot::legend)仅需设置QCustomPlot::setAutoAddPlottableToLegend为true(默认行为)就可以自动创建一些legend项,legend是一个与特定可绘制对象相关的对象,可以被QCPAbstractPlottable::removeFromLegend去除。
此外,QCPLegend提供了一些接口增加和直接管理这些legend:item、itemWithPlottable、itemCount、addItem、removeItem等。因为QCPLegend是从QCPLayoutGrid继承而来的,因此通过对象QCPLayoutElement可以将legend添加到任意位置,legend是QCPLayoutElement的元素,默认情况下每一个QCustomPlot只有一个legend(QCustomPlot::legend),表示主轴的内嵌布局中(QCPAxisRect::insetLayout),你可以通过QCPLayoutInset实现在矩形区域移动,使用QCPLayout/QCPLayoutElement接口实现矩形外移动。
默认情况下,在往 QCustomPlot 中添加绘图板的时候,默认已经添加了图例,这个特性可以通过属性 QCustomPlot::setAutoAddPlottableToLegend 来改变。
常用的函数:
setVisible、setFont、setTextColor设置legend是否显示,字体大小、颜色
removeItem 设置不显示哪一项
QCPAbstractLegendItem *item(int index) //得到具体某一项的item
QCPPlottableLegendItem *itemWithPlottable() //根据曲线图元得到具体某一项
设置图例位置,这里设置左上角
customPlot->axisRect()->insetLayout()->setInsetAlignment(0, Qt::AlignLeft | Qt::AlignTop);
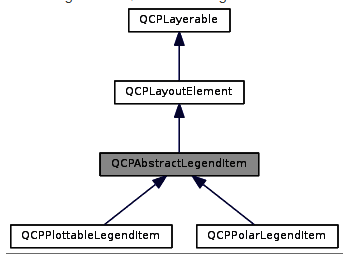
QCPAbstractLegendItem
构造函数QCPAbstractLegendItem(QCPLegend *parent);
可知parent即为图例
常用的函数
setFont 设置字体
setTextColor 设置字体颜色
槽函数 selectionChanged
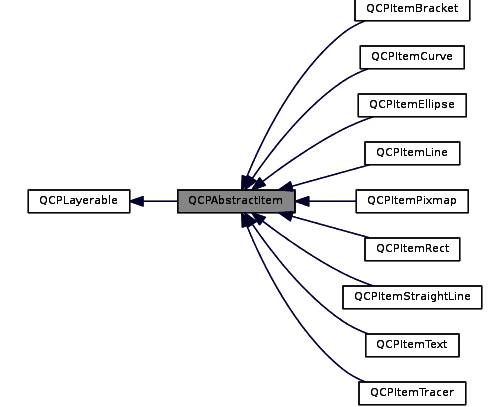
QCPAbstractItem
所有的项目的基类是 QCPAbstractItem,项目和绘图板分开,这样的话项目就不依赖任何的坐标轴,这意味着项目可以放置在像素的绝对位置或者矩形区域的相对位置。除此之外,项目通常不直接显示数据,而是扮演着装饰,强调和描述等作用。
常见的场景
数据量很大(几万个点或者几十万点),但界面只有一屏,最多显示1千多个点,怎处理呢?
第一种办法:QCPGraph开启自适应采样(setAdaptiveSampling(true)),默认就是开启自适应采样。这样界面就不会卡顿。
第二种办法就是:自己先编写采样抽取数据的函数,然后再把抽样好的数据填充到曲线上。
大数据量数据实时变化,界面也跟着定时刷新
开线程更新数据,使用互斥锁。
开定时器,QCPGraph调用setdata设置数据,调用QCustomPlot的replot函数进行刷新即可。
交互处理
1.QCustomPlot 通常会发射下面的信号,直接在QCustomPlot对象上进行鼠标操作,如QCustomPlot::mouseDoubleClick等;当图元对象被单击或双击后,请看 QCustomPlot::plottableClick,QCustomPlot::plottableDoubleClick;当坐标轴被单击或双击QCustomPlot::axisClick等;当图例被单击或双击时QCustomPlot::legendClick
如鼠标点击曲线某一位置,信号槽处理。从槽函数可以得到点击的是哪一条曲线,是哪一个数据,点击的位置。
    connect(mPlot,SIGNAL(mouseDoubleClick(QMouseEvent *)),this,SLOT(plotmouseDoubleClickslot(QMouseEvent *)));
    connect(mPlot,SIGNAL(plottableClick(QCPAbstractPlottable*,int,QMouseEvent*)),this,SLOT(plottableClickSlot(QCPAbstractPlottable*,int,QMouseEvent*)));
    connect(mPlot,SIGNAL(legendClick(QCPLegend *, QCPAbstractLegendItem *, QMouseEvent *)),this,SLOT(plotlegendClickslot(QCPLegend *, QCPAbstractLegendItem *, QMouseEvent *)));

void QCustomPlotWidget::plottableClickSlot(QCPAbstractPlottable *plottable, int dataIndex, QMouseEvent *event)
{
    QPoint point = event->pos();
    qDebug() << "plottableClickSlot"<< dataIndex << "point:" << point.x() << ","<< point.y() ;
    int a =1;
}

void QCustomPlotWidget::plotmouseDoubleClickslot(QMouseEvent *event)
{
    QPoint point = event->pos();
    qDebug() << "plotmouseDoubleClickslot" << "point:" << point.x() << ","<< point.y() ;
    int a =1;
}

void QCustomPlotWidget::plotlegendClickslot(QCPLegend *legend, QCPAbstractLegendItem *item, QMouseEvent *event)
{
     QPoint point = event->pos();
    int ncount = legend->itemCount();
    for(int i = 0; i < ncount; ++i)
    {
        if(item == legend->item(i))
        {
            bool bshow = mGraph[i]->visible();
            bshow = !bshow;
            mGraph[i]->setVisible(bshow);
            QColor col = item->textColor();
            col = bshow? m_col[i] : Qt::darkGray;
            item->setTextColor(col);
            mPlot->replot();
            qDebug() << "plotlegendClickslot"<<"item="<<i << "point:" << point.x() << ","<< point.y() ;
        }
    }
}
也可以控制 QCPLayerable 的鼠标的事件的虚函数,可以自己去创造子类,重写虚函数。
2.QCustomPlot 支持通过鼠标来拖拽坐标轴的范围(QCPAxisRect::setRangeDrag),通过鼠标滚轮来缩放坐标轴的范围(QCPAxisRect::setRangeZoom)和一个完整的选择机制,可以通过数据点的位置和范围来配置。
这些可用的交互方式由 QCustomPlot::setInteractions 来控制。见上面
3.QCPDataSelection及QCPDataRange
数据选择机制,即曲线选中后,获取选中的数据。
前提条件是:QCustomPlot对象调用setInteractions(QCP::iSelectPlottables);
setSelectionRectMode(QCP::SelectionRectMode::srmSelect)和selectionChangedByUser信号两进行设置。见上面
通过QCPGraph曲线对象调用selection函数得到 QCPDataSelection 。再调用QCPDataSelection的dataRange函数得到QCPDataRange.通过QCPDataRange的begin和end得到数据的索引,最后通过索引得到曲线的key和value.
预处理定义
QCustomPlot 解析一些预处理的定义,有助于debug和编译,这些定义必须定义在包含的 QCustomPlot 头文件之前,通常来说最好的方式是添加在qmake中:DEFINES += QCUSTOMPLOT_USE_OPENGL
QCUSTOMPLOT_USE_OPENGL:如果定义了这个,QCustomPlot 可以使用 OpenGL 来提升图像的绘制性能,看 QCustomPlot::setOpenGl
QCUSTOMPLOT_COMPILE_LIBRARY:当需要将QCustomPlot定义为共享库的时候需要添加此宏
QCUSTOMPLOT_USE_LIBRARY:在包含 QCustomPlot 的头文件的之前定义此宏,当使用 QCustomPlot 作为动态库来使用的时候
QCUSTOMPLOT_CHECK_DATA:如果定义了此宏,QCustomPlot 的绘图板将会在每一次的图像重绘的时候验证数据,他将会输出qDubug的输出,编码数据的。


 594
594

 被折叠的 条评论
为什么被折叠?
被折叠的 条评论
为什么被折叠?
 到【灌水乐园】发言


