


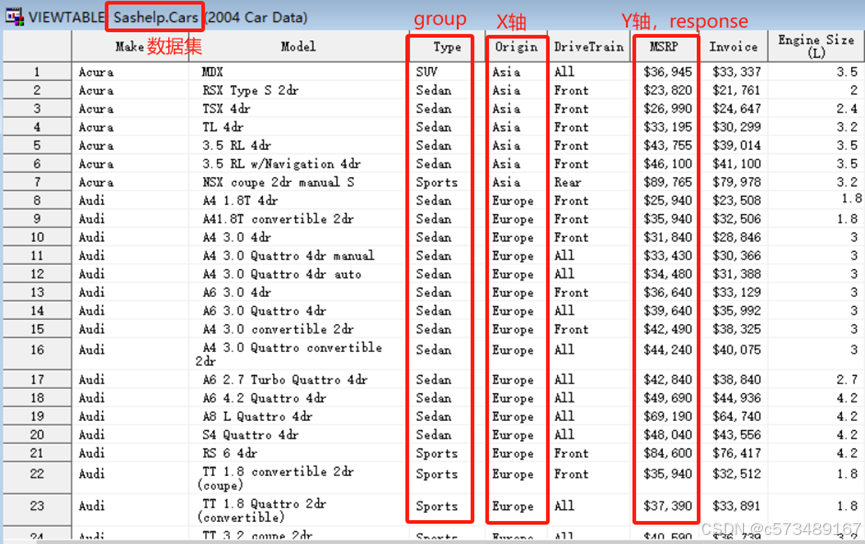
1、绘图-直条图示例:
1.1 数据集
1.2 代码
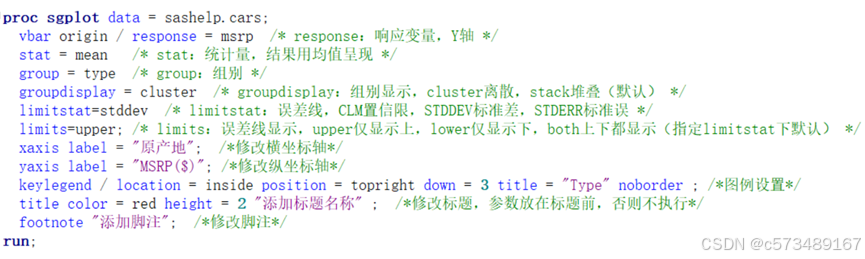
proc sgplot data = sashelp.cars;
vbar origin / response = msrp /* response:响应变量,Y轴 */
stat = mean /* stat:统计量,结果用均值呈现 */
group = type /* group:组别 */
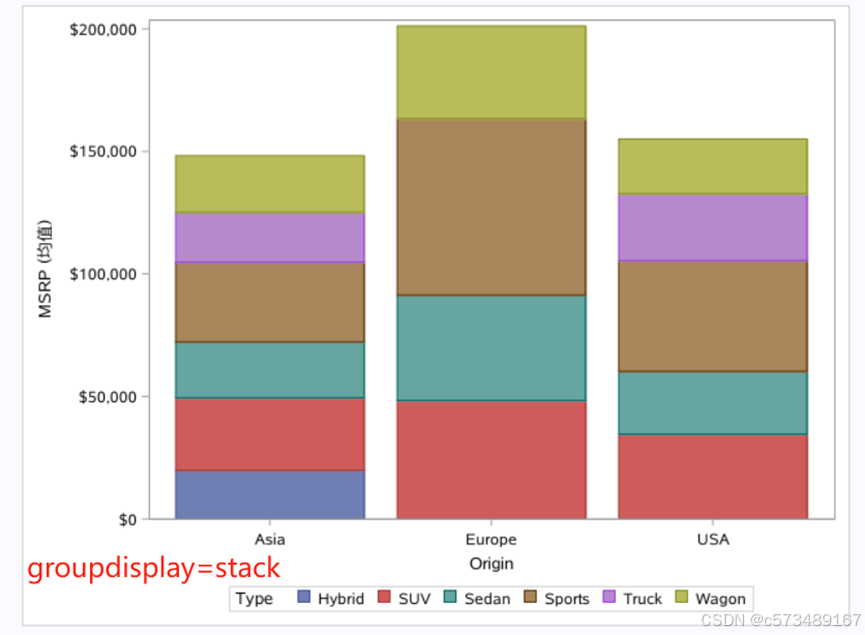
groupdisplay = cluster /* groupdisplay:组别显示,cluster离散,stack堆叠(默认) */
limitstat=stddev /* limitstat:误差线,CLM置信限,STDDEV标准差,STDERR标准误 */
limits=upper; /* limits:误差线显示,upper仅显示上,lower仅显示下,both上下都显示(指定limitstat下默认) */
xaxis label = "原产地"; /*修改横坐标轴*/
yaxis label = "MSRP($)"; /*修改纵坐标轴*/
keylegend / location = inside position = topright down = 3 title = "Type" noborder ; /*图例设置*/
title color = red height = 2 "添加标题名称" ; /*修改标题,参数放在标题前,否则不执行*/
footnote "添加脚注"; /*修改脚注*/
run;
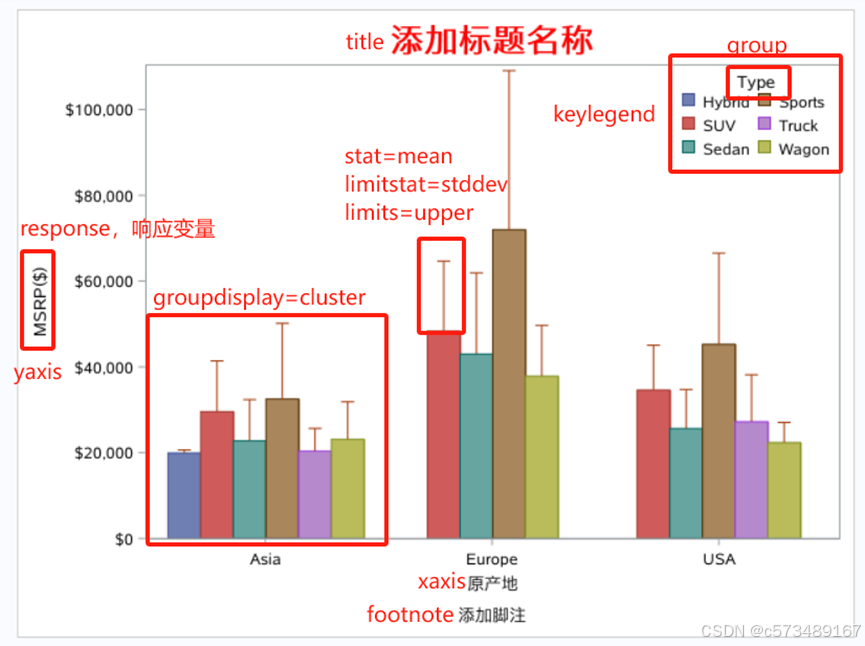
1.3 绘图结果参数解释
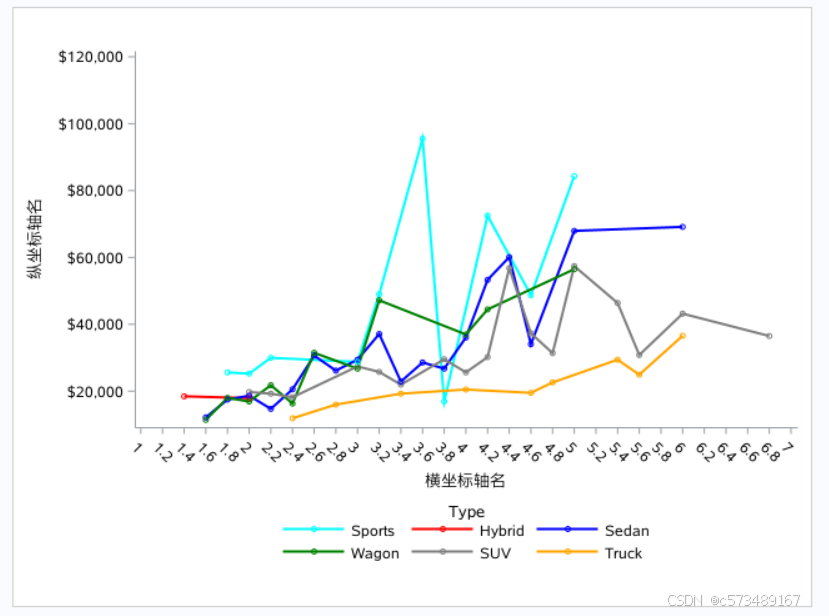
2、绘图-折线图示例:
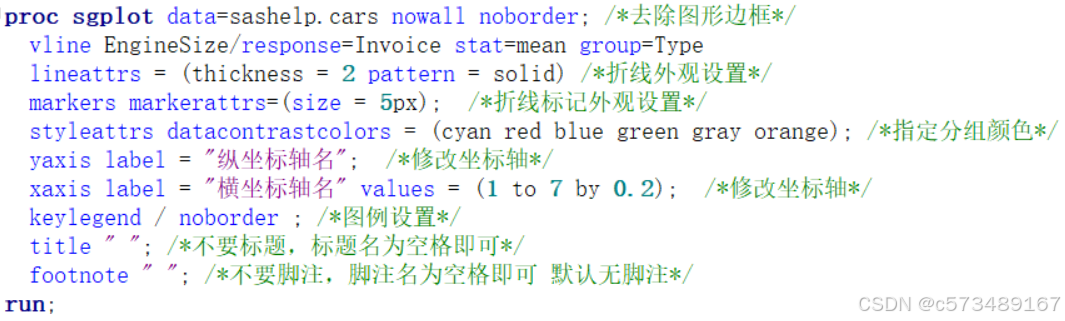
proc sgplot data=sashelp.cars nowall noborder; /*去除图形边框*/
vline EngineSize/response=Invoice stat=mean group=Type
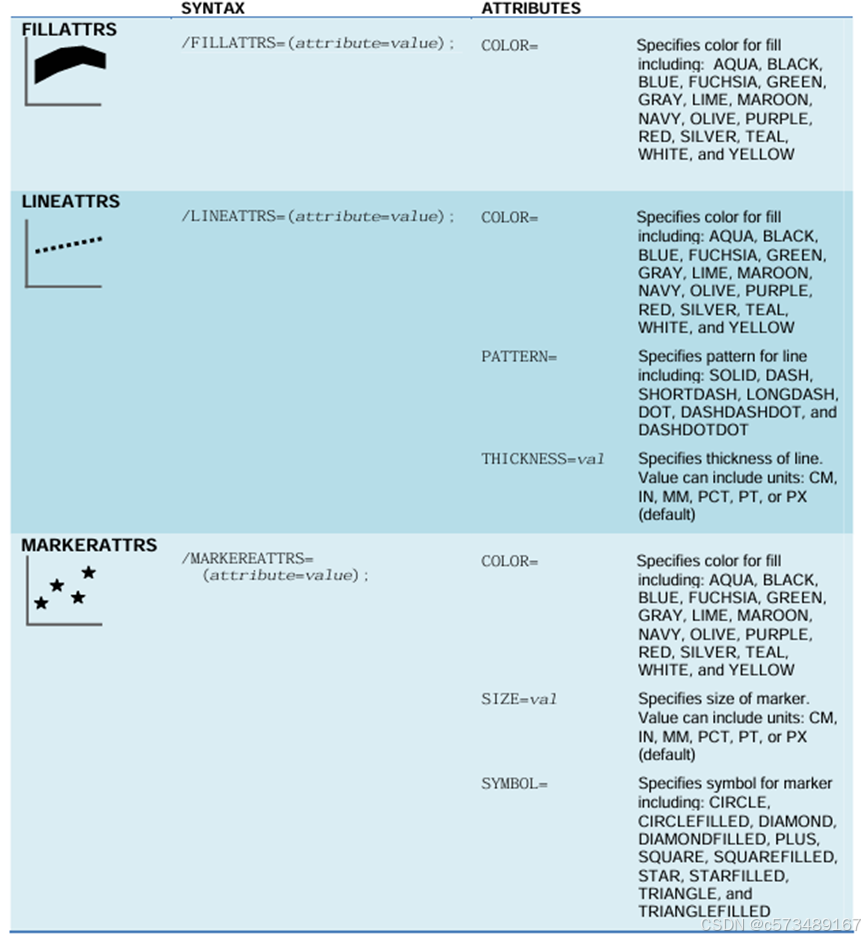
lineattrs = (thickness = 2 pattern = solid) /*折线外观设置*/
markers markerattrs=(size = 5px); /*折线标记外观设置*/
styleattrs datacontrastcolors = (cyan red blue green gray orange); /*指定分组颜色*/
yaxis label = "纵坐标轴名"; /*修改坐标轴*/
xaxis label = "横坐标轴名" values = (1 to 7 by 0.2); /*修改坐标轴*/
keylegend / noborder ; /*图例设置*/
title " "; /*不要标题,标题名为空格即可*/
footnote " "; /*不要脚注,脚注名为空格即可 默认无脚注*/
run;
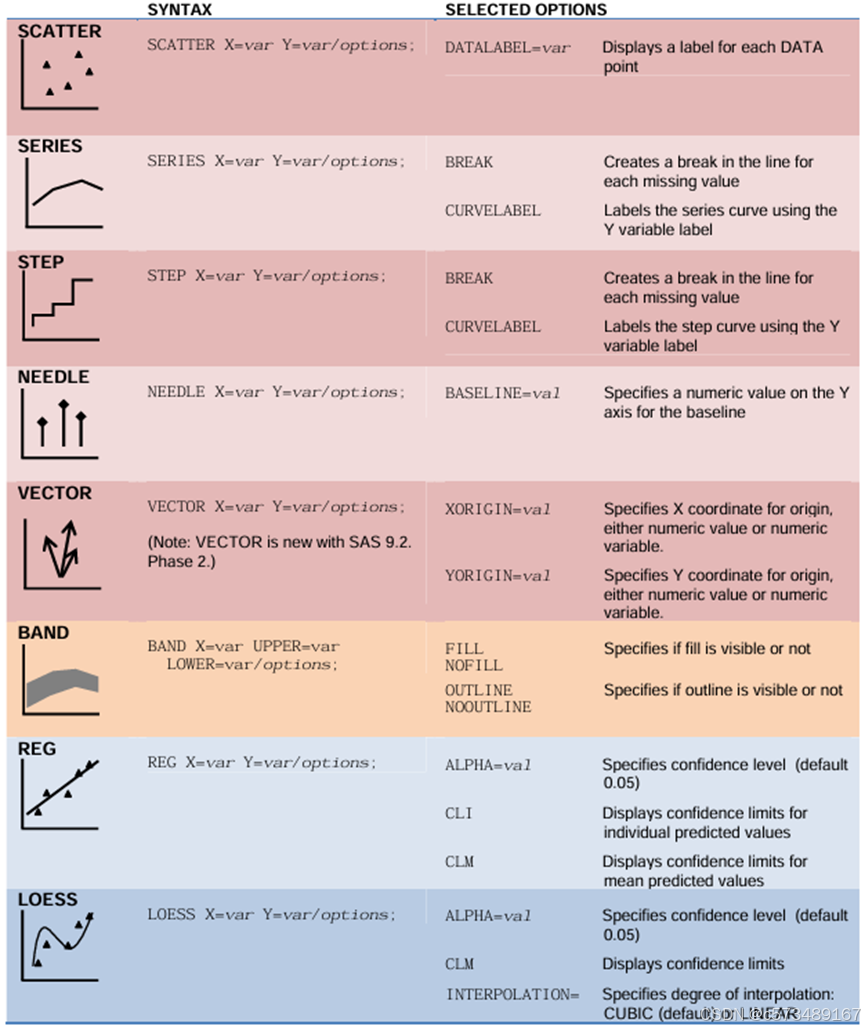
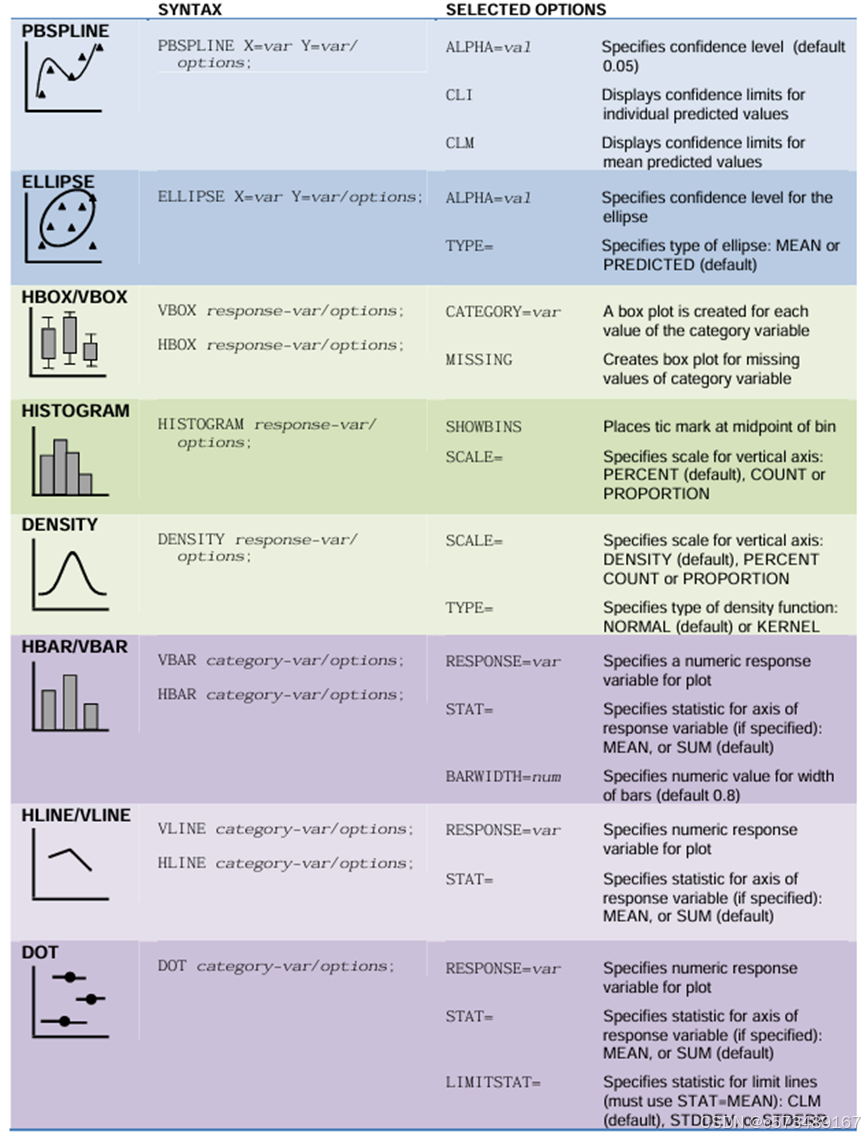
3、proc sgplot绘图类型:
参考资料
https://support.sas.com/resources/papers/proceedings10/154-2010.pdf
https://support.sas.com/resources/papers/proceedings19/3167-2019.pdf
4、title的参数:
修改标题的外观
TITLE statement options:
BCOLOR=背景框的颜色
BLANK=防止盒标题覆盖标题
BOX=加标题框
COLOR=字体颜色
FONT=字体
HEIGHT=设置文本高度
MOVE=选项使用绝对坐标并导致文本断行
ROTATE=旋转
UNDERLIN=加下划线
参考资料
SAS/GRAPH Statements: Example 6. Enhancing Titles
https://support.sas.com/documentation/cdl/en/graphref/63022/HTML/default/viewer.htm#gr08n06-ex.htm
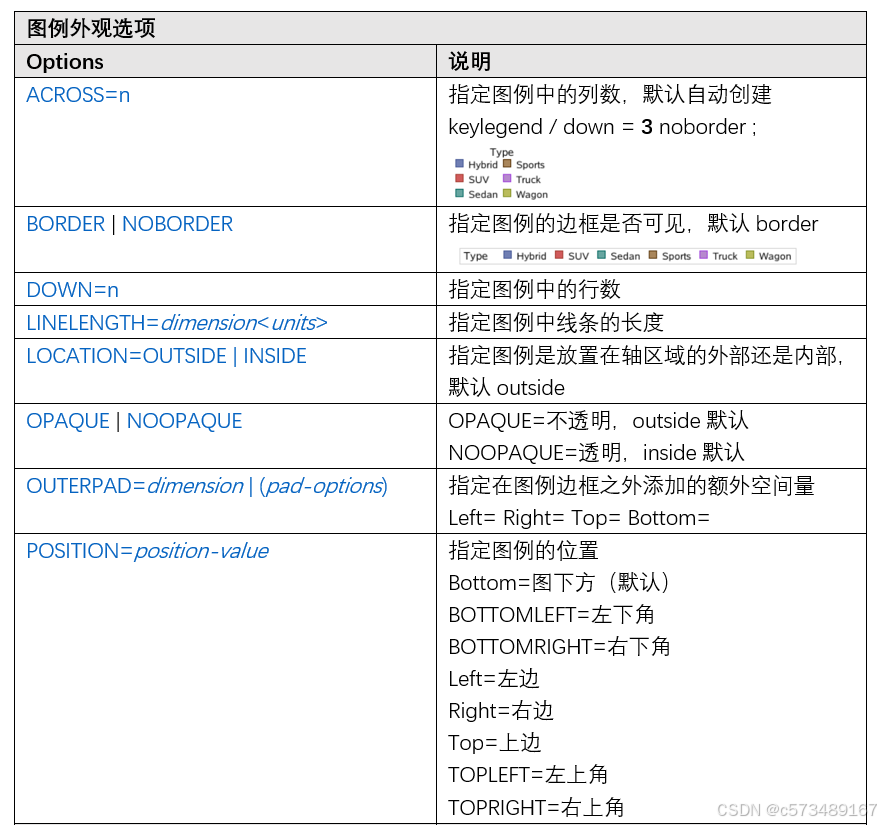
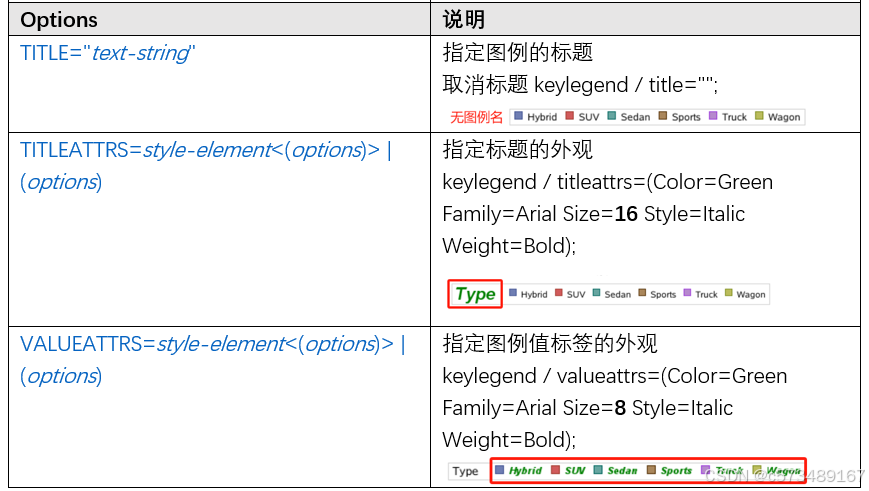
5、keylegend的参数(sgplot绘图):
keylegend “name-1” … “name-n” / options
5.1 图例外观选项
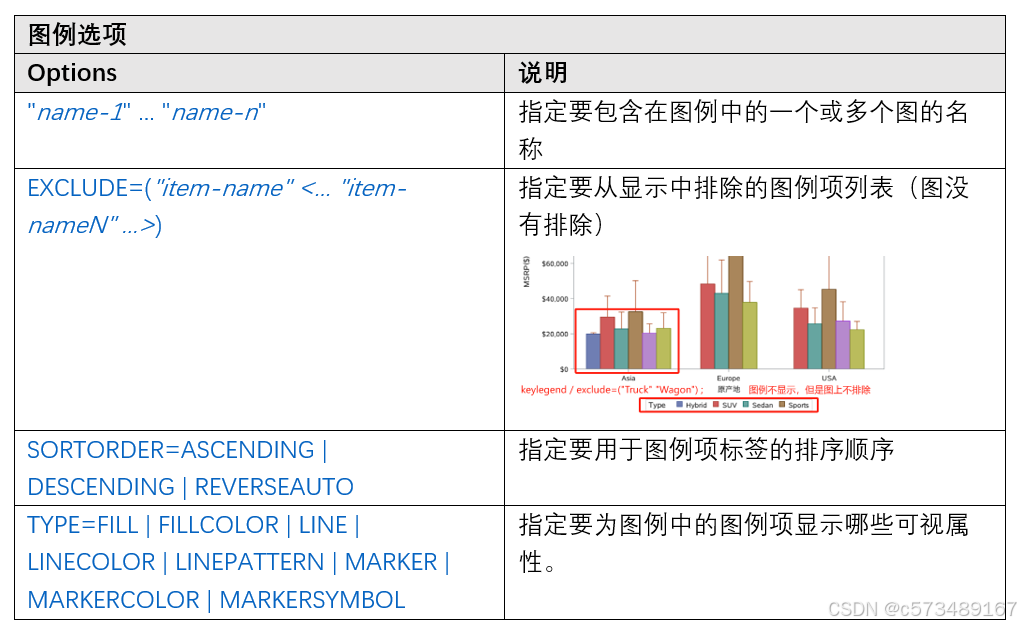
5.2 图例选项
5.3 Marker标记选项

参考资料
SAS Help Center: Syntax: PROC SGPLOT KEYLEGEND Statement
https://documentation.sas.com/doc/en/pgmsascdc/9.4_3.5/grstatproc/p0xmbppzx71smbn1203aaif96z86.htm


 2674
2674

 被折叠的 条评论
为什么被折叠?
被折叠的 条评论
为什么被折叠?
 到【灌水乐园】发言


