


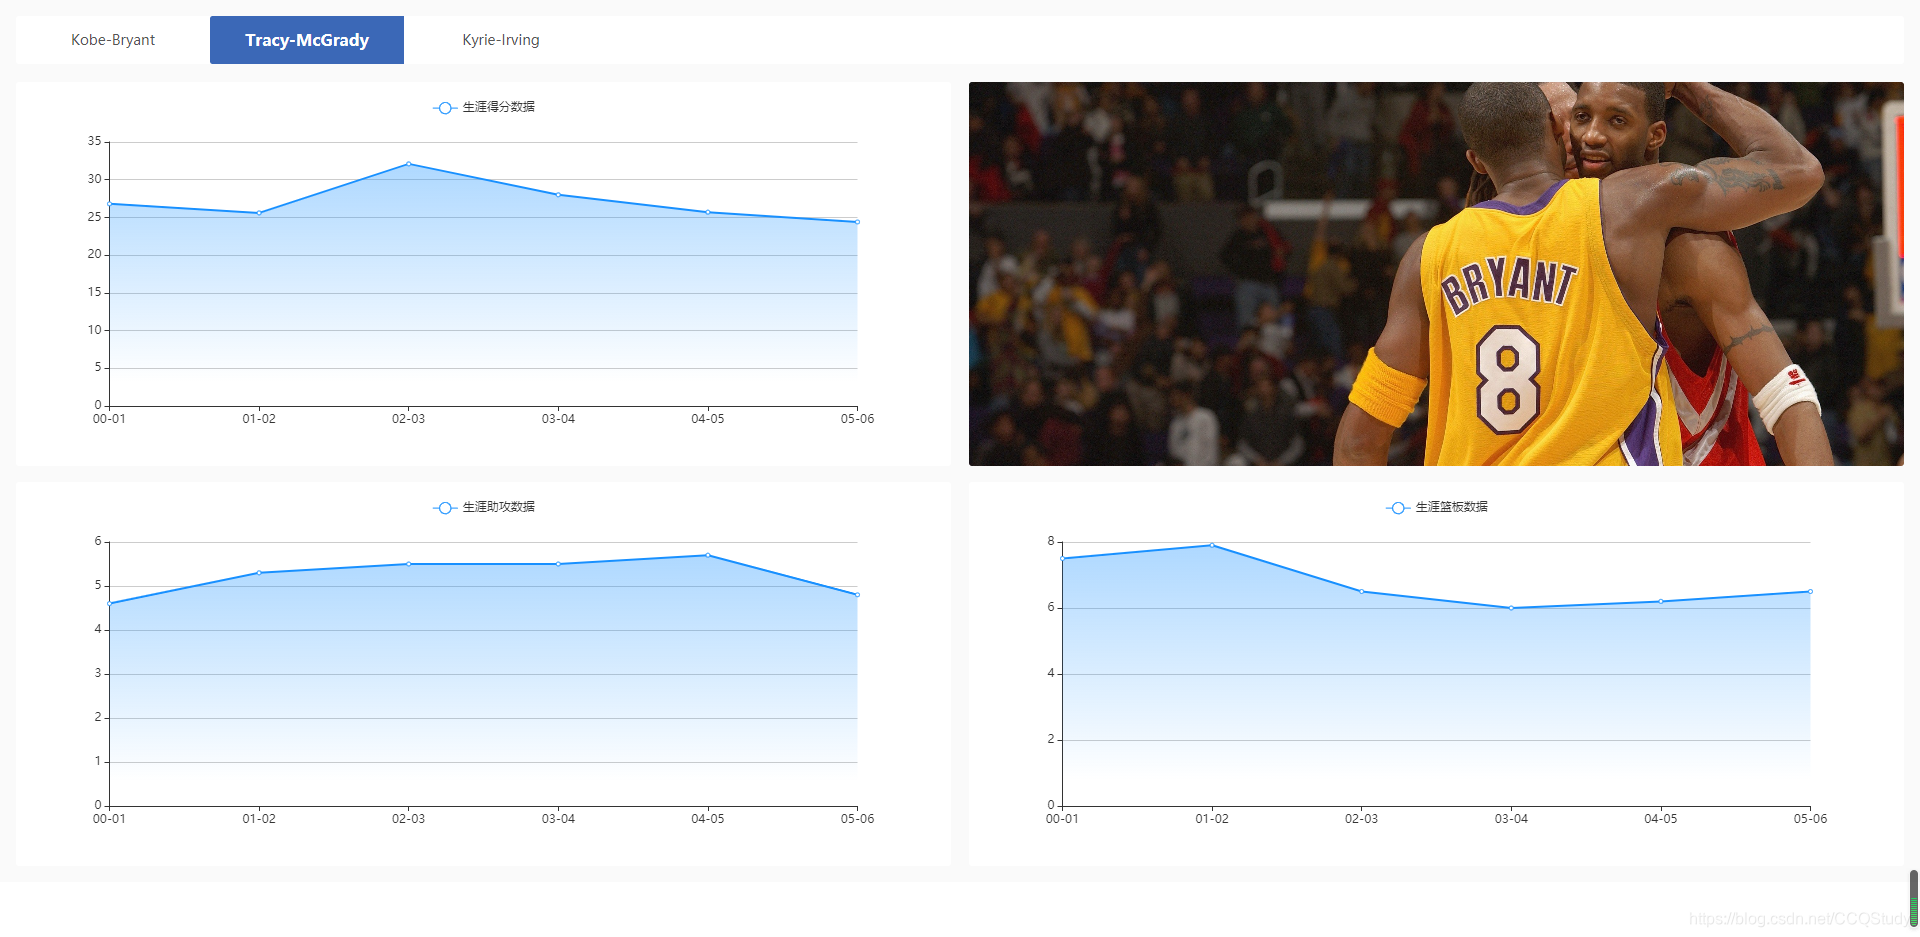
1.我这边是写了一个简单的tabDemo,展示NBA球星科比、麦迪、欧文的职业生涯得分、助攻、篮板 数据。页面效果如下图:
两种方式的话,为了便于区别,我单独创建了两个tsx组件:LineChartII.tsk和LineChart.tsx。
主页组件中引入使用:(传递的参数一样,关注引入echarts的引入加载方式)
import LineChart from './components/LineChart';
import LineChartII from './components/LineChartII';
<div className={style.contentItem}>
            <LineChartII
              color={active[0] ? '#ffec3d' : active[1] ? '#1890ff' : '#f5222d'}
              shdowBegin={
                active[0]
                  ? 'rgb(255,236,61,0)'
                  : active[1]
                  ? 'rgb(24,144,255,0)'
                  : 'rgb(245,34,45,0)'
              }
              shdowEnd={
                active[0]
                  ? 'rgb(255,236,61,0.5)'
                  : active[1]
                  ? 'rgb(24,144,255,0.5)'
                  : 'rgb(245,34,45,0.5)'
              }
              title={'生涯得分数据'}
              dataX={season}
              dataY={score}
            />
          </div>
<div className={style.contentItem}>
            <LineChart
              color={active[0] ? '#ffec3d' : active[1] ? '#1890ff' : '#f5222d'}
              shdowBegin={
                active[0]
                  ? 'rgb(255,236,61,0)'
                  : active[1]
                  ? 'rgb(24,144,255,0)'
                  : 'rgb(245,34,45,0)'
              }
              shdowEnd={
                active[0]
                  ? 'rgb(255,236,61,0.5)'
                  : active[1]
                  ? 'rgb(24,144,255,0.5)'
                  : 'rgb(245,34,45,0.5)'
              }
              title={'生涯助攻数据'}
              dataX={season}
              dataY={assit}
            />
          </div>
2.第一种引入方式:使用echarts-for-react插件在React中调用echarts接口直接渲染出Echarts图表,只要传入相关的参数和数据即可。(个人觉得这种方式更简单,注:需要下载插件依赖)
npm install --save echarts-for-react
关键代码:
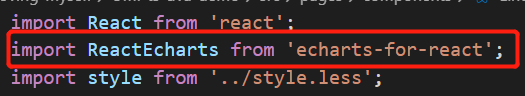
LineChartII.tsx组件完整内容:
import React from 'react';
import ReactEcharts from 'echarts-for-react';
import style from '../style.less';
interface LineDataProps {
color: string;
shdowBegin?: string;
shdowEnd?: string;
title: string;
dataX: string[];
dataY: number[];
}
export const LineChart: React.FC<LineDataProps> = props => {
const { color, shdowBegin, shdowEnd, title, dataX, dataY } = props;
const option = {
legend: {
data: [title],
top: '15',
},
tooltip: {
trigger: 'axis',
formatter: (params: any) => {
// 自定义 弹窗里面的 内容
let str = `<div>
<span> ${params[0].name}赛季</span><br/>
<span>场均${
title.indexOf('得分') > -1 ? '得分' : title.indexOf('助攻') > -1 ? '助攻' : '篮板'
}:${params[0].value}${title.indexOf('得分') > -1 ? '分' : '个'} </span>
</div>`;
return str;
},
},
position: 'center',
xAxis: {
type: 'category',
boundaryGap: false,
data: dataX,
},
yAxis: {
type: 'value',
},
series: [
{
name: title,
data: dataY,
type: 'line',
// symbol: 'none', //取消折点圆圈
itemStyle: {
normal: {
color: color, //改变折线点的颜色
lineStyle: {
color: color, //改变折线颜色(组件传参过来)
},
},
},
areaStyle: {
color: {
x: 0,
y: 0,
x2: 0,
y2: 1,
colorStops: [
{
offset: 0,
color: shdowEnd, // 0% 处的颜色
},
{
offset: 0.9,
color: shdowBegin, // 100% 处的颜色
},
],
globalCoord: false, // 缺省为 false
},
},
},
],
};
return (
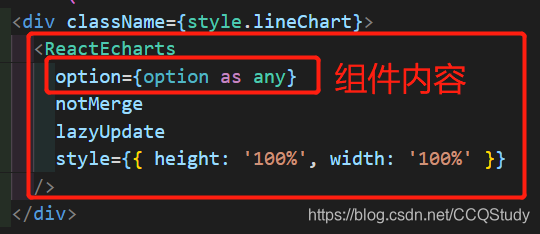
<div className={style.lineChart}>
<ReactEcharts
option={option as any}
notMerge
lazyUpdate
style={{ height: '100%', width: '100%' }}
/>
</div>
);
};
export default LineChart;
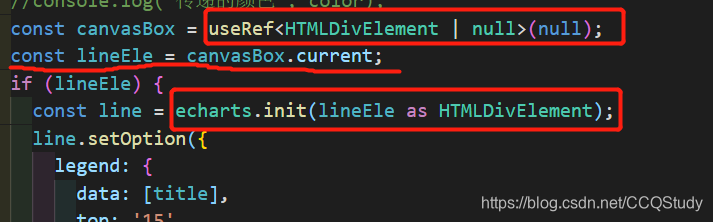
3.第二种引入方式:使用useRef 返回一个可变的 ref 对象,作用于DOM对象, 在DOM对象中引入加载echarts内容。
核心代码:
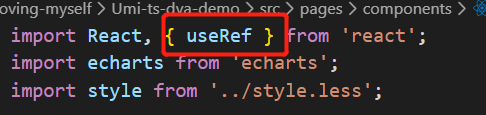

LineChartII.tsx组件完整内容:
import React, { useRef } from 'react';
import echarts from 'echarts';
import style from '../style.less';
interface LineDataProps {
  color: string;
  shdowBegin?: string;
  shdowEnd?: string;
  title: string;
  dataX: string[];
  dataY: number[];
}
export const LineChart: React.FC<LineDataProps> = props => {
  const { color, shdowBegin, shdowEnd, title, dataX, dataY } = props;
  const canvasBox = useRef<HTMLDivElement | null>(null);
  const lineEle = canvasBox.current;
  if (lineEle) {
    const line = echarts.init(lineEle as HTMLDivElement);
    line.setOption({
      legend: {
        data: [title],
        top: '15',
      },
      tooltip: {
        trigger: 'axis',
        formatter: (params: any) => {
          // 自定义 弹窗里面的 内容
          let str = `<div>
              <span> ${params[0].name}赛季</span><br/>
               <span>场均${
                 title.indexOf('得分') > -1 ? '得分' : title.indexOf('助攻') > -1 ? '助攻' : '篮板'
               }:${params[0].value}${title.indexOf('得分') > -1 ? '分' : '个'} </span>
           </div>`;

          return str;
        },
      },
      position: 'center',
      xAxis: {
        type: 'category',
        boundaryGap: false,
        data: dataX,
      },
      yAxis: {
        type: 'value',
      },
      series: [
        {
          name: title,
          data: dataY,
          type: 'line',
          // symbol: 'none', //取消折点圆圈
          itemStyle: {
            normal: {
              color: color, //改变折线点的颜色
              lineStyle: {
                color: color, //改变折线颜色(组件传参过来)
              },
            },
          },
          areaStyle: {
            color: {
              x: 0,
              y: 0,
              x2: 0,
              y2: 1,
              colorStops: [
                {
                  offset: 0,
                  color: shdowEnd, // 0% 处的颜色
                },
                {
                  offset: 0.9,
                  color: shdowBegin, // 100% 处的颜色
                },
              ],
              globalCoord: false, // 缺省为 false
            },
          },
        },
      ],
    });
  }
  return <div className={style.lineChart} ref={canvasBox}></div>;
};
export default LineChart;


 1万+
1万+


 被折叠的 条评论
为什么被折叠?
被折叠的 条评论
为什么被折叠?
 到【灌水乐园】发言


