


函数语法:
Title(label, fontdict=None, loc=None, pad=None, *, y=None, **kwargs)
函数功能:
Set a title for the axes.
设置坐标系标题
函数参数:
label: str ,Text to use for the title
字符串,用于标题文本内容
fontdictdict: A dictionary controlling the appearance of the title text, the default fontdict is:
字体字典项:控制标题文本展现,默认设置如下:
{'fontsize': rcParams['axes.titlesize'],
 'fontweight': rcParams['axes.titleweight'],
 'color': rcParams['axes.titlecolor'],
 'verticalalignment': 'baseline',
 'horizontalalignment': loc}
loc: {‘center’, ‘left’, ‘right’}, default: rcParams[“axes.titlelocation”] (default: ‘center’)。Which title to set
标题文本的位置,默认’center’,可以设置’center’, ‘left’, ‘right’,控制标题的左右移动
y: float, default: rcParams[“axes.titley”] (default: None)
Vertical axes loation for the title (1.0 is the top). If None (the default), y is determined automatically to avoid decorators on the axes.
浮点型,标题的垂直位置(顶部是1.0)。 如果为None(默认),则自动确定,控制标题的上下移动
pad: float, default: rcParams[“axes.titlepad”] (default: 6.0)。The offset of the title from the top of the axes, in points.
浮点型,标题离轴顶部的偏移量,默认6
Other Parameters:
**kwargs: Text properties 。Other keyword arguments are text properties
其他参数 : 设置其他文本属性,控制标签文本的展示外观
增加图形标题:Title

设置标题字体:fontdict
import matplotlib.pyplot as plt
import numpy as np

x = np.linspace(0.05, 10, 1000)
y = np.cos(x)

plt.plot(x, y,ls = '--',lw = 2,label = 'plot figure')

plt.legend(loc = 'lower left') #指定图例位置

plt.xlabel('x-axis')   #增加x轴标签
plt.ylabel('y-label')  #设置标签字体字典

plt.title('y = cos(x)',fontdict = {'fontsize': 18,'fontweight':100,'color': 'green',
           'verticalalignment':'bottom','horizontalalignment':'left'})  #设置标题字体

plt.show()

fonsize: float or {‘xx-small’, ‘x-small’, ‘small’, ‘medium’, ‘large’, ‘x-large’, ‘xx-large’}
字体大小: 浮点型,或者取值为{‘xx-small’, ‘x-small’, ‘small’, ‘medium’, ‘large’, ‘x-large’, ‘xx-large’}
fonweight: {a numeric value in range 0-1000, ‘ultralight’, ‘light’, ‘normal’, ‘regular’, ‘book’, ‘medium’, ‘roman’, ‘semibold’, ‘demibold’, ‘demi’, ‘bold’, ‘heavy’, ‘extra bold’, ‘black’}
字体粗细: 可取值:0-1000之间的数值, ‘ultralight’, ‘light’, ‘normal’, ‘regular’, ‘book’, ‘medium’, ‘roman’, ‘semibold’, ‘demibold’, ‘demi’, ‘bold’, ‘heavy’, ‘extra bold’, ‘black’
color: 字体颜色
verticalalignment: 垂直对齐,可取值:‘center’, ‘top’, ‘bottom’, ‘baseline’, ‘center_baseline’
horizontalalignment: 水平对齐,可取值: ‘center’, ‘right’, ‘left’
关于verticalalignment和horizontalalignment的使用仍需要后期了解发现。
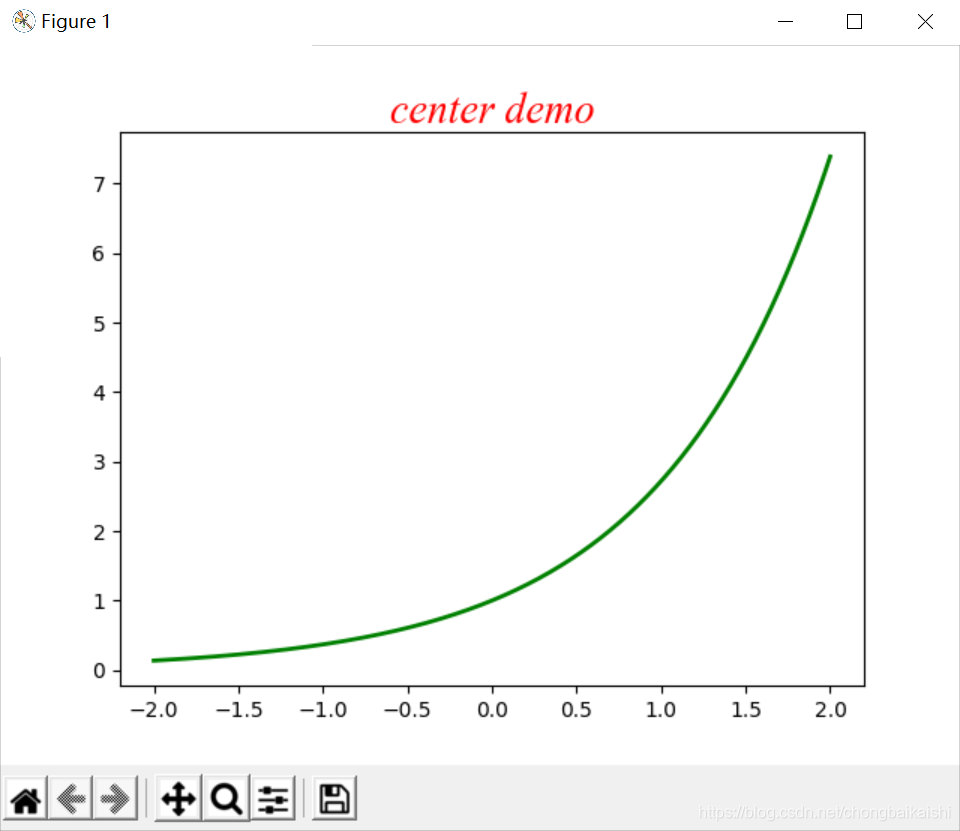
import matplotlib.pyplot as plt
import numpy as np

x = np.linspace(-2,2,1000)
y = np.exp(x)

plt.plot(x,y,ls='-',lw=2,color='g')

plt.title('center demo',fontdict={
                    'fontsize': 20,  #字体大小
                    'fontweight':'light',  #字体粗细, ‘light’, ‘normal’, ‘medium’, ‘semibold’, ‘bold’, ‘heavy’, ‘black’
                    'color':'r',  #字体颜色
                    'verticalalignment':'top',# 垂直对齐方式,'center', 'top', 'bottom', 'baseline', 'center_baseline'
                    'horizontalalignment':'center',#睡哦ing对齐方式,'center', 'right', 'left'
                    'family':'Times New Roman',   #字体系列,它的值有很多,比如 “宋体”,“微软雅黑”等等
                    'fontstyle':'italic'    #字体风格:它的值有:normal(默认值)、italic(斜体)、oblique(倾斜)
})

plt.show()
loc参数设置标签的左右移动位置,loc = ‘right’

设置标签的垂直位置,y = 0.5

设置标签的垂直位置,y = 0.0

设置标签的垂直位置,y =1.0(默认设置)

通过pad设置标题偏离图顶部的距离 pad =26

更改pad参数,标题偏离图顶部的距离发生改变,pad=6(默认值)


 1万+
1万+

 被折叠的 条评论
为什么被折叠?
被折叠的 条评论
为什么被折叠?
 到【灌水乐园】发言


