 回归评估指标详解


 本文详细介绍了回归分析中常用的评估指标,包括MAE、MSE、RMSE等误差度量方法,以及Pearson's Correlation Coefficient和Concordance Correlation Coefficient等衡量变量间相关性的方法。
回归(Regression)不同于分类问题,在回归方法中我们预测一系列连续的值,在预测完后有个问题是如何评价预测的结果好坏,关于这个问题目前学术界也没有统一的标准。下面是我在论文中的看到的一些常用方法,希望对有缘人有用。
1 MAE(Mean Absolute Error)平均绝对差值
In statistics, the mean absolute error (MAE) is a quantity used to measure how close forecasts or predictions are to the eventual outcomes. The mean absolute error is given by
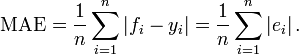
As the name suggests, the mean absolute error is an average of the absolute errors 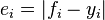 , where
  is the prediction and
  the true value. Note that alternative formulations may include relative frequencies as weight factors.
注意:MAE与 MAD(Mean Absolute Difference)等价。此外,MAE很容易跟absolute deviation(绝对偏差)混淆,它们的定义很类似,但使用的场景完全不同;绝对偏差针对的就是一组数据,而MAD针对的两组数据(预测值一组,真实值一组)。
2 MSE(Mean Square Error)均方误差
If  is a vector of n predictions, and
  is the vector of the true values, then the (estimated) MSE of the predictor is:
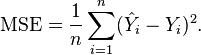
3 RMSE(Root Mean Square error)均方根误差
RMSE跟RMSD(Root-mean-square deviation)均方根偏差的定义等价,RMSE实际上就是MSE的平方根。
The RMSD of an estimator  with respect to an estimated parameter
  is defined as the square root of the mean square error:

For an unbiased estimator, the RMSD is the square root of the variance, known as the standard error.
The RMSD of predicted values  for times t of a regression's dependent variable
  is computed for n different predictions as the square root of the mean of the squares of the deviations:

In some disciplines, the RMSD is used to compare differences between two things that may vary, neither of which is accepted as the "standard". For example, when measuring the average difference between two time series  and
and  , the formula becomes

The normalized root-mean-square deviation or error (NRMSD or NRMSE) is the RMSD divided by the range of observed values of a variable being predicted,or:
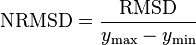
The value is often expressed as a percentage, where lower values indicate less residual variance.
5 coefficient of variation of the RMSD
The coefficient of variation of the RMSD, CV(RMSD), or more commonly CV(RMSE), is defined as the RMSD normalized to the mean of the observed values:

It is the same concept as the coefficient of variation except that RMSD replaces the standard deviation.
-------------------------------------------------------------------------------------------------------------------------------------------
Correlation Coefficient(相关系数)相关表和相关图可反映两个变量之间的相互关系及其相关方向,但无法确切地表明两个变量之间相关的程度。于是,著名统计学家卡尔·皮尔逊设计了统计指标——相关系数(Correlation coefficient)。相关系数是用以反映变量之间相关关系密切程度的统计指标。相关系数是按积差方法计算,同样以两变量与各自平均值的离差为基础,通过两个离差相乘来反映两变量之间相关程度;着重研究线性的单相关系数。
依据相关现象之间的不同特征,其统计指标的名称有所不同。如将反映两变量间线性相关关系的统计指标称为相关系数(相关系数的平方称为判定系数);将反映两变量间曲线相关关系的统计指标称为非线性相关系数、非线性判定系数;将反映多元线性相关关系的统计指标称为复相关系数、复判定系数等。
相关关系是一种非确定性的关系,相关系数是研究变量之间线性相关程度的量。由于研究对象的不同,相关系数有如下几种定义方式:
6 Pearson's Correlation Coefficient(皮尔逊相关系数)
有的论文里叫COR(相关性)
相关系数:考察两个事物(在数据里我们称之为变量)之间的相关程度。
如果有两个变量:X、Y,最终计算出的相关系数的含义可以有如下理解:
(1)、当相关系数为0时,X和Y两变量无关系。
(2)、当X的值增大(减小),Y值增大(减小),两个变量为正相关,相关系数在0.00与1.00之间。
(3)、当X的值增大(减小),Y值减小(增大),两个变量为负相关,相关系数在-1.00与0.00之间。
相关系数的绝对值越大,相关性越强,相关系数越接近于1或-1,相关度越强,相关系数越接近于0,相关度越弱。
通常情况下通过以下取值范围判断变量的相关强度:
相关系数 0.8-1.0 极强相关
0.6-0.8 强相关
0.4-0.6 中等程度相关
0.2-0.4 弱相关
0.0-0.2 极弱相关或无相关
皮尔逊相关也称为积差相关(或积矩相关)是英国统计学家皮尔逊于20世纪提出的一种计算直线相关的方法。
假设有两个变量X、Y,那么两变量间的皮尔逊相关系数可通过以下公式计算:
公式一:

公式二:

公式三:

公式四:

以上列出的四个公式等价,其中E是数学期望,cov表示协方差,N表示变量取值的个数。
注意当两个变量的标准差都不为零时,相关系数才有定义,皮尔逊相关系数适用于:
(1)、两个变量之间是线性关系,都是连续数据。
(2)、两个变量的总体是正态分布,或接近正态的单峰分布。
(3)、两个变量的观测值是成对的,每对观测值之间相互独立。
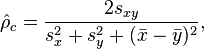
7 concordance correlation coefficient(一致性相关系数)
In statistics, the concordance correlation coefficient measures the agreement between two variables, e.g., to evaluate reproducibility or for inter-rater reliability.
Definition:
Lawrence Lin has the form of the concordance correlation coefficient  as
as

where  and
and  are the means for the two variables and
  and
and  are the corresponding variances.
  is the correlation coefficient between the two variables.
This follows from its definition[1] as

When the concordance correlation coefficient is computed on a N-length data set (i.e., two vectors of length N) the form is
where the mean is computed as

and the variance

and the covariance

Whereas the ordinary correlation coefficient (Pearson's) is immune to whether the biased or unbiased versions for estimation of the variance is used, the concordance correlation coefficient is not. In the original article Lin suggested the 1/N normalization, while in another article Nickerson appears to have used the 1/(N-1), i.e., the concordance correlation coefficient may be computed slightly differently between implementations.
Relation to other measures of correlation
The concordance correlation coefficient is nearly identical to some of the measures called intra-class correlations, and comparisons of the concordance correlation coefficient with an "ordinary" intraclass correlation on different data sets found only small differences between the two correlations, in one case on the third decimal. It has also been stated that the ideas for concordance correlation coefficient "are quite similar to results already published by Krippendorff in 1970".
In the original article[1] Lin suggested a form for multiple classes (not just 2). Over ten years later a correction to this form was issued.
One example of the use of the concordance correlation coefficient is in a comparison of analysis method for functional magnetic resonance imaging brain scans.
Reference:
http://en.wikipedia.org/wiki/Concordance_correlation_coefficient
http://en.wikipedia.org/wiki/Correlation_coefficient
http://en.wikipedia.org/wiki/Root_mean_square_error
http://blog.csdn.net/wsywl/article/details/5727327
转载请注明转载自:http://blog.csdn.net/computerme/article/details/38871467


 5万+
5万+

 被折叠的 条评论
为什么被折叠?
被折叠的 条评论
为什么被折叠?
 到【灌水乐园】发言


