


 本文详细介绍了在Varnish出现常规段错误时,如何通过获取核心转储、定位崩溃点、深入调查错误,最终解决故障。作者通过实例展示了如何使用LLDB调试器,分析了可能导致问题的原因,如内存分配库jemalloc的错误或线程池实现的双释放问题。文章还提到了重建Varnish并替换内存库以进一步排查问题的方法。
unity清漆shader
This article was originally published on the 99designs Tech Blog
本文最初发布在99designs技术博客上
At 99designs we heavily (ab)use Varnish to make our app super fast, but also to do common, simple tasks without having to invoke our heavy-by-contrast PHP stack. As a result, our Varnish config is pretty involved, containing more than 1000 lines of VCL, and a non-trivial amount of embedded C.
在99designs,我们大量(ab)使用Varnish来使我们的应用程序变得超快,而且无需执行逐一对比PHP堆栈即可执行常见的简单任务。 结果,我们的Varnish配置非常复杂,包含超过1000行的VCL以及大量的嵌入式C。
When we started seeing regular segfaults, it was a pretty safe assumption that one of us had goofed writing C code. So how do you track down a transient segfault in a system like Varnish? Join us down the rabbit hole…
当我们开始看到常规的段错误时,这是一个非常安全的假设,即我们中的一个人已经无聊地编写了C代码。 那么,如何在Varnish之类的系统中追踪瞬态段故障? 和我们一起去兔子洞...
获取核心转储 (Get a core dump)
The first step is to modify your production environment to provide you with useful core dumps. There are a few steps in this:
第一步是修改生产环境,为您提供有用的核心转储。 其中有几个步骤:
First of all, configure the kernel to provide core dumps by setting a few sysctls:
首先,通过设置一些sysctls来配置内核以提供核心转储:
echo 1 > /proc/sys/kernel/core_uses_pid
echo 2 > /proc/sys/fs/suid_dumpable
mkdir /mnt/cores
chmod 777 /mnt/cores
echo  /mnt/cores/core > /proc/sys/kernel/core_pattern
In order, this:
按此顺序:
- Tells the kernel to append pid’s to core files to make it easy to marry up the cores with the logs 告诉内核将pid附加到核心文件中,以便轻松地将核心与日志结合在一起
Tells the kernel that suid binaries are allowed to dump core
告诉内核,允许suid二进制文件转储内核
- Creates a place to store cores on AWS’s ephemeral storage (if like us you’re on EC2) 创建一个将核心存储在AWS临时存储中的位置(如果像我们一样,您使用的是EC2)
- Tells the kernel to write core files out there 告诉内核在那里写核心文件
With this done, and no known way to trigger the bug, play the waiting game.
完成此操作,并且没有已知的方式触发错误,请玩等待游戏。
When varnish explodes, it’s show time. Copy the core file, along with the shared object that varnish emits from compiling the VCL (Located in
/var/lib/varnish/$HOSTNAME) over to a development instance and let the debugging begin.当清漆爆炸时,它是显示时间。 将核心文件以及varnish编译VCL(位于
/var/lib/varnish/$HOSTNAME)发出的共享对象复制到开发实例中,然后开始进行调试。
找到崩溃点 (Locate the crash point)
If you have access to the excellent LLDB from the LLVM project, use that. In our case, getting it to work on Ubuntu 12.04 involves upgrading half the system, resulting in an environment too dissimilar to production.
如果您可以从LLVM项目访问优秀的LLDB ,请使用它。 在我们的案例中,使其在Ubuntu 12.04上运行需要升级一半的系统,从而导致与生产环境过于不同的环境。
If you spend a lot of time in a debugger, you’ll probably want to use a helper like fG!’s gdbinit or voltron to make your life easier. I use voltron, but because of some of the clumsiness in gdb’s API, immediately ran into some bugs.
如果您在调试器上花费大量时间,则可能需要使用诸如fG!的gdbinit或voltron之类的助手来简化您的生活。 我使用的是voltron,但由于gdb API的某些笨拙之处,因此立即遇到了一些 bug 。
Finally, debugging environment working, it’s time to dig into the crash. Your situation is going to be different to ours, but here’s how we went about debugging a problem like this recently:
最后,在调试环境正常工作的时候,该深入了解崩溃了。 您的情况将与我们的情况有所不同,但是最近这是我们调试此类问题的方式:
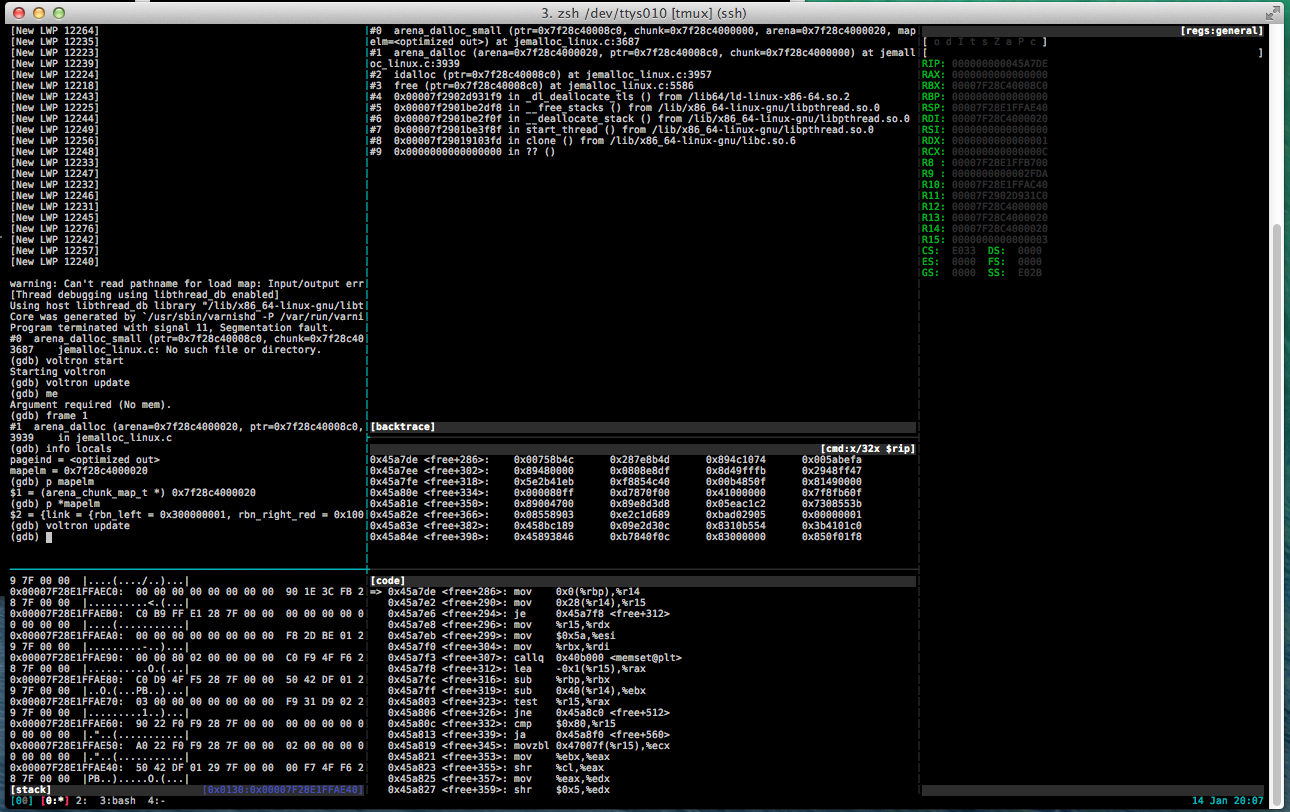
Debugging the core dump with voltron
使用Voltron调试核心转储
Debugging the core dump with voltron
使用Voltron调试核心转储
As you can see in the code pane, the faulting instruction is mov 0x0(%rbp),%r14, trying to load the value pointed to by RBP into r14. Looking in the register view we see that RBP is NULL.
在code窗格中可以看到,错误指令是mov 0x0(%rbp),%r14 ,试图将RBP指向的值加载到r14 。 在寄存器视图中,我们看到RBP为NULL。
Inspecting the source, we see that the faulting routine is inlined, and that the compiler has hijacked RBP (The base pointer for the current stack frame) to use as argument storage for the inline routine
检查源代码,我们看到故障例程已内联,并且编译器劫持了RBP(当前堆栈帧的基本指针)用作内联例程的参数存储
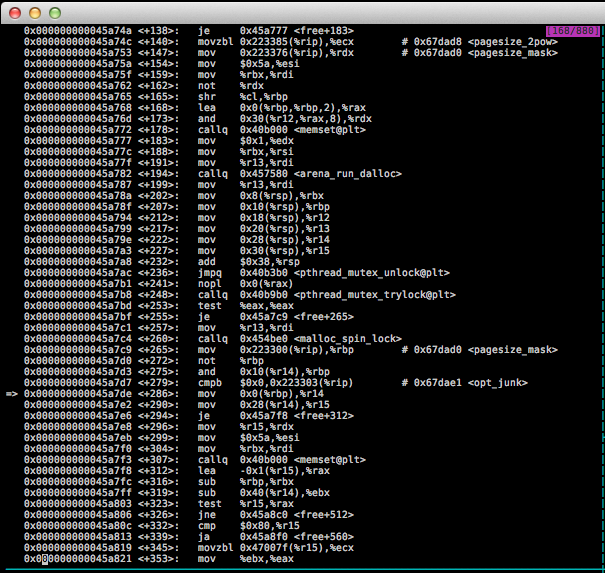
The offending assembly code
令人反感的汇编代码
The offending assembly code
令人反感的汇编代码
Of specific interest is this portion:
这部分特别感兴趣:
0x000000000045a7c9 <+265>:   mov    0x223300(%rip),%rbp        # 0x67dad0 <pagesize_mask>
   0x000000000045a7d0 <+272>:   not    %rbp
   0x000000000045a7d3 <+275>:   and    0x10(%r14),%rbp
   0x000000000045a7d7 <+279>:   cmpb   $0x0,0x223303(%rip)        # 0x67dae1 <opt_junk>
=> 0x000000000045a7de <+286>:   mov    0x0(%rbp),%r14
   0x000000000045a7e2 <+290>:   mov    0x28(%r14),%r15
Which in plain english:
用简单的英语:
Loads a
riprelative address intorbp(pagesize_mask)将
rip相对地址加载到rbp(pagesize_mask)Inverts
rbpbitwise按位反转
rbpPerforms a bitwise and against 16 bytes into the structure pointed to by
r14, (mapelm->bits)对
r14指向的结构按16位字节按位执行(mapelm->bits)Pointlessly checks if pagesize_mask is
NULL无意义地检查pagesize_mask是否为
NULLTries to load the address pointed to by
rbpintor14, which faults.尝试将
rbp指向的地址加载到r14,这会出错。
Which is emitted by:
发出者:
static inline void
arena_dalloc_small(arena_t *arena, arena_chunk_t *chunk, void *ptr,
    arena_chunk_map_t *mapelm)
{
    arena_run_t *run;
    arena_bin_t *bin;
    size_t size;

    run = (arena_run_t *)(mapelm->bits & ~pagesize_mask);
    assert(run->magic == ARENA_RUN_MAGIC);
    bin = run->bin; // XXX KABOOM
    size = bin->reg_size;
We now know that the fault is caused by a mapelm struct with a bits member set to zero; but why are we getting passed this broken struct with garbage in it?
现在我们知道故障是由mapelm结构引起的,该结构的bits成员设置为零。 但是为什么我们要通过带有垃圾的破碎结构呢?
深入挖掘 (Digging in deeper)
Since this function is declared inline, it’s actually folded into the calling frame. The only reason it actually appears as in the backtrace is because the callsite is present in the DWARF debugging data.
由于此函数是内联声明的,因此实际上已折叠到调用框架中。 它真正出现在回溯中的唯一原因是因为呼叫站点存在于DWARF调试数据中。
We can poke at the value by inferring its location from the upstream assembly, but it’s easier to jump into the next upstream frame and inspect that:
我们可以通过从上游组件中推断出它的位置来戳取该值,但是跳到下一个上游框架并检查它更容易:
(gdb) frame 1
#1  arena_dalloc (arena=0x7f28c4000020, ptr=0x7f28c40008c0, chunk=0x7f28c4000000) at jemalloc_linux.c:3939
3939    in jemalloc_linux.c
(gdb) info locals
pageind = <optimized out>
mapelm = 0x7f28c4000020
(gdb) p *mapelm
$3 = {link = {rbn_left = 0x300000001, rbn_right_red = 0x100002fda}, bits = 0}
(gdb)
So this looks like an element in a red black tree, with two neighours and a null for the bits member. Let’s double check:
因此,这看起来像是一棵红黑树中的元素,带有两个邻居,并且bits成员为null。 让我们仔细检查一下:
(gdb) ptype *mapelm
type = struct arena_chunk_map_s {
    struct {
        arena_chunk_map_t *rbn_left;
        arena_chunk_map_t *rbn_right_red;
    } link;
    size_t bits;
}
(gdb) ptype arena_run_t
type = struct arena_run_s {
    arena_bin_t *bin;
    unsigned int regs_minelm;
    unsigned int nfree;
    unsigned int regs_mask[1];
}
(gdb)
Wait, what?
等一下
Looking back to get our bearings:
回头看我们的轴承:
run = (arena_run_t *)(mapelm->bits & ~pagesize_mask);The code is trying to generate a pointer to this arena run structure, using the number of bits in the mapelm struct, AND against the inverse pagesize_mask to locate the start of a page. Because bits is zero, this is the start of the zero page; a NULL pointer.
代码正在尝试使用mapelm结构中的位数生成指向此竞技场运行结构的指针,并将其与反pagesize_mask相对,以找到页面的开始。 因为bits为零,所以这是零页的开始; 空指针。
This is enough to see how it’s crashing, but doesn’t give us much insight for why. Let’s go digging.
这足以了解它是如何崩溃的,但并不能为我们提供太多的解释。 我们去挖吧。
Looking back at the code snippet, we see an assertion that the arena_run_t structure’s magic member is correct, so with that known we can go looking for other structures in memory. A quick grep turns up:
回顾一下代码片段,我们可以断言arena_run_t结构的magic成员是正确的,因此有了已知的知识,我们就可以在内存中寻找其他结构。 快速grep出现:
./lib/libjemalloc/malloc.c:# define ARENA_RUN_MAGIC 0x384adf93pagesize_mask is just the page size -1, meaning that any address bitwise AND against the inverse of the pagesize_mask will give you the address at the beginning of that page.
pagesize_mask只是页面大小-1,这意味着与pagesize_mask取反的任何按位与地址将为您提供该页面开始处的地址。
We can therefore just search every writable page in memory for the magic number at the correct offset.
因此,我们可以在内存中的每个可写页面上以正确的偏移量搜索幻数。
.. Or can we?
..还是可以吗?
typedef struct arena_run_s arena_run_t;
struct arena_run_s {
#ifdef MALLOC_DEBUG
    uint32_t    magic;
#  define ARENA_RUN_MAGIC 0x384adf93
#endif

    /* Bin this run is associated with. */
    arena_bin_t *bin;
...
The magic number and magic member of the struct (Conveniently located as the first 4 bytes of each page) only exists if we’ve got a debug build.
结构的幻数和幻数成员(通常位于每个页面的前4个字节中)仅在我们具有调试版本的情况下存在。
另外:我们可以滥用LD_PRELOAD牟利吗? (Aside: can we abuse LD_PRELOAD for profit?)
At this point all signs point to either a double free in varnish’s thread pool implementation, leading to an empty bucket (bits == 0), or a bug in its memory allocation library jemalloc.
此时,所有迹象都表明清漆的线程池实现中有一个double free,导致一个空存储桶( bits == 0),或者是其内存分配库jemalloc中的错误。
In theory, it should be pretty easy to rule out jemalloc, by swapping in another malloc library implementation. We could do that by putting, say tcmalloc, in front of its symbol resolution path using LD_PRELOAD:
从理论上讲,通过交换另一个malloc库实现,排除jemalloc应该很容易。 我们可以通过使用LD_PRELOAD将tcmalloc放在其符号解析路径的前面来实现:
We’ll add:
我们将添加:
export LD_PRELOAD=/usr/lib/libtcmalloc_minimal.so.0to /etc/varnish/default and bounce varnish. Then move all the old core files out of the way, wait (and benchmark!)
到/etc/varnish/default并反弹清漆。 然后将所有旧的核心文件移开,等待(并进行基准测试!)
However, there’s a flaw in our plan. Older versions of varnish (remember that we’re on an LTS distribution of Ubuntu) vendor in a copy of jemalloc and statically link it, meaning that the symbols free and malloc are resolved at compile time, not runtime. This means no easy preload hacks for us.
但是,我们的计划存在缺陷。 较旧版本的varnish(请记住,我们在Ubuntu的LTS发行版上)供应商提供jemalloc副本,并将其静态链接,这意味着free和malloc符号在编译时而不是在运行时解析。 对于我们来说,这意味着没有简单的预加载技巧。
重建清漆 (Rebuilding Varnish)
The easy solution won’t work, so let’s do the awkward one: rebuild varnish!
简单的解决方案行不通,所以让我们做一个尴尬的事情:重建清漆!
apt-get source varnishGrab a copy of the varnish source, and link it against tcmalloc. Before that though, I deleted lib/libjemalloc and used grep to remove every reference to jemalloc from the codebase (Which was basically just some changes to the configure script and makefiles)
获取清漆源的副本,并将其链接到tcmalloc。 但是在此之前,我删除了lib/libjemalloc并使用grep从代码库中删除了对jemalloc的所有引用(这基本上只是对configure脚本和makefile的一些更改)
and then add -ltcmalloc_minimal to CFLAGS before building. As an aside, the ubuntu packages for tcmalloc ship /usr/lib/libtcmalloc_minimal.so.0 but not /usr/lib/libtcmalloc_minimal.so, which means the linker can’t find them. I had to manually create a symlink.
然后在构建之前将-ltcmalloc_minimal添加到CFLAGS 。 顺便说一句,用于tcmalloc的ubuntu软件包附带了/usr/lib/libtcmalloc_minimal.so.0而不是/usr/lib/libtcmalloc_minimal.so ,这意味着链接程序找不到它们。 我不得不手动创建一个符号链接。
With this new varnish in production, we haven’t yet seen the same crash, so it appears that it was a bug in jemalloc, probably a nasty interaction between libpthread and libjemalloc (The crash was consistently inside thread initialization).
有了这个新的清漆,我们还没有看到过相同的崩溃,因此看来这是jemalloc中的一个错误,可能是libpthread和libjemalloc之间的讨厌的交互(崩溃始终在线程初始化内)。
自己尝试一下? (Try it yourself?)
Let’s hope not. But if you do a lot of Varnish hacking with custom extensions, occasional C bugs are to be expected. This post walked you through a tricky Varnish bug, giving you an idea of the tools and tricks around debugging similar hairy segfaults.
我们希望不要。 但是,如果您使用自定义扩展程序进行大量的Varnish黑客攻击,则偶尔会遇到C错误。 这篇文章向您介绍了一个棘手的Varnish错误,使您对调试类似多毛的段错误的工具和技巧有所了解。
If you’re messing around with voltron, you might find my voltron config and the tmux script I use to setup my environment a useful starting point.
如果您不喜欢Voltron,可能会发现我的Voltron配置和用于设置环境的tmux脚本是一个有用的起点。
unity清漆shader


 1725
1725

 被折叠的 条评论
为什么被折叠?
被折叠的 条评论
为什么被折叠?
 到【灌水乐园】发言


