


macos 控制台颜色
The Console app in macOS is a system-wide viewer for debug messages and log files. You can use it to track down errors in applications or just get an idea for what’s going on in your system.
macOS中的Console应用程序是系统范围的查看器,用于调试消息和日志文件。 您可以使用它来跟踪应用程序中的错误,或者只是了解系统中正在发生的事情。
Most everything in this app is not intended for the average user to view, as it’s made for developers who have a better understanding of the macOS operating system. Warnings and errors are very common during normal use of your computer, so don’t get worried if you see a lot of them here.
该应用程序中的大多数内容都不适合普通用户查看,因为它是为对macOS操作系统有更好了解的开发人员开发的。 警告和错误在正常使用计算机期间非常常见,因此,如果在此处看到很多警告和错误,请不要担心。
阅读控制台 (Reading The Console)
You can launch the Console app from Spotlight by pressing Command+Space and searching for it, or from the Utilities folder in your Applications directory. (Open Finder and select “Applications” to find it.)
您可以通过按Command + Space并搜索从Spotlight启动Console应用程序,也可以从Applications目录中的Utilities文件夹启动它。 (打开Finder,然后选择“应用程序”进行查找。)
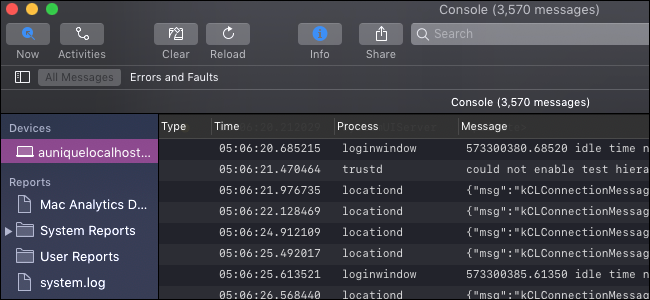
The first thing you’ll see is the console itself. This logs every message sent out by processes and services running on your system. It updates very quickly, so you’ll have to use some sorting if you want to make any sense of it.
您会看到的第一件事是控制台本身。 这将记录系统上运行的进程和服务发出的所有消息。 它的更新速度非常快,因此,如果您想对其进行任何理解,就必须使用某种排序方式。
Up in the toolbar, there’s a button called “Now,” which will automatically scroll the window down as new messages come in. This can be useful if you’re trying to debug in real time.
在工具栏中,有一个名为“ Now”的按钮,当有新消息进入时,该按钮将自动向下滚动窗口。如果您尝试实时调试,这将很有用。
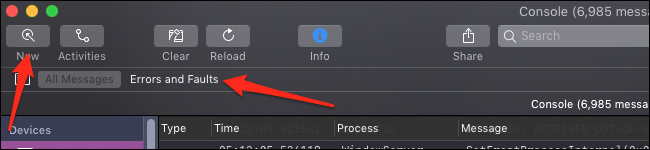
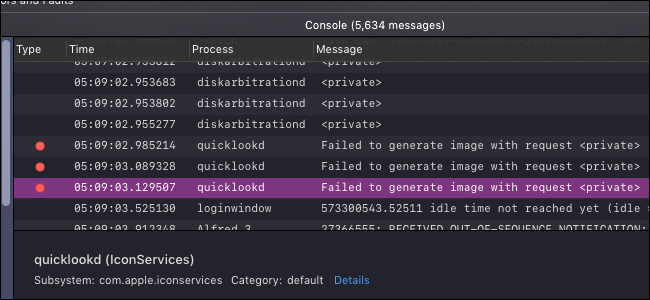
You can also choose to only view Errors and Faults, which will filter out everything without a red or yellow dot next to it, and only show the important things you might want to see.
您还可以选择仅查看“错误和故障”,这将过滤掉所有内容,并且旁边没有红色或黄色的点,并且仅显示您可能希望看到的重要内容。
There’s also a search bar here, which has the added functionality of being able to search by different parameters. Just type anything in, press Enter, and then change the parameter from the “Any” dropdown:
这里还有一个搜索栏,它具有可以按不同参数搜索的附加功能。 只需输入任何内容,按Enter,然后从“任何”下拉列表中更改参数:
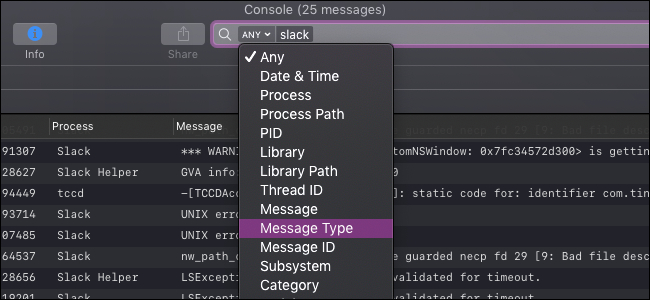
You can use this to narrow down the console to only show messages relevant to your problem.
您可以使用它来缩小控制台范围,使其仅显示与您的问题相关的消息。
Another view is the “Activities” panel, which will sort console messages according to the activity they’re associated with:
另一个视图是“活动”面板,该面板将根据控制台消息与之关联的活动对其进行排序:
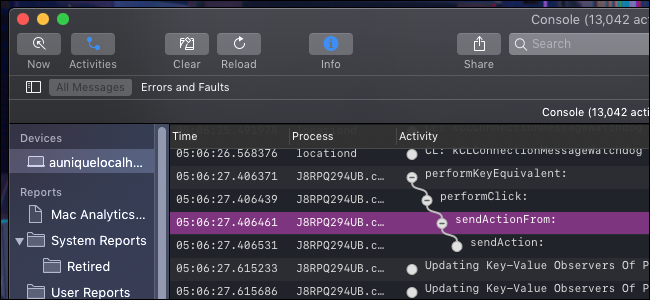
These are ordered hierarchically, so you’ll have to click the white “+” button next to each one to expand it.
这些按层次结构排序,因此您必须单击每个按钮旁边的白色“ +”按钮以展开它。
日志查看器 (The Log Viewer)
Your system’s logs function like more detailed, more permanent console messages. You’ll find them under the “Reports” section in the sidebar.
系统日志的功能类似于更详细,更永久的控制台消息。 您可以在侧栏中的“报告”部分下找到它们。
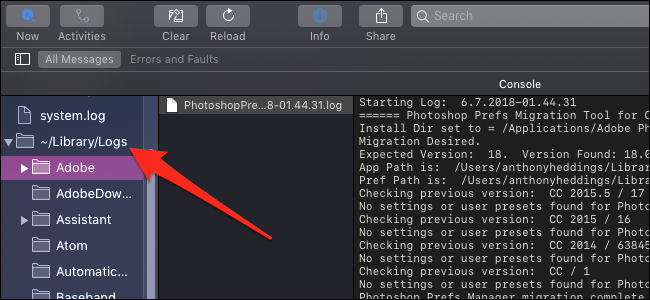
The logs are split into different categories, and you’ll find most user-level apps have their logs in “~/Library/Logs”, split up by the application. Lower level processes might have theirs in “/Library/Logs” or “/var/log.” These all exist on disk as well, so you can navigate to these folders to copy the file itself if you need to send it to someone else.
日志分为不同的类别,您会发现大多数用户级应用程序的日志都在“〜/ Library / Logs”中,并按应用程序进行了划分。 较低级别的进程可能在“ / Library / Logs”或“ / var / log”中。 这些文件也都存在于磁盘上,因此,如果需要将文件发送给其他人,则可以导航到这些文件夹以复制文件本身。
There are also the “System Reports” and “User Reports” categories, which will group together logs for system processes and user apps.
还有“系统报告”和“用户报告”类别,它们会将系统进程和用户应用程序的日志分组在一起。
翻译自: https://www.howtogeek.com/406592/how-to-use-the-console-on-macos-to-check-log-and-activities/
macos 控制台颜色


 376
376


 被折叠的 条评论
为什么被折叠?
被折叠的 条评论
为什么被折叠?
 到【灌水乐园】发言


